





Nasdaq 100 Forecast: Trade War Escalates
Much now hinges on Trump’s rhetoric—should he soften his tone, markets might find some relief. If not, the risk of prolonged volatility looms large, particularly as April 2 approaches—a date dubbed “liberation day” by Trump. So, the near-term Nasdaq 100 forecast remains uncertain and dependant on Trump’s rhetoric.
Share this:

At present, the markets seem wholly preoccupied with trade war tensions, leaving little room for other narratives. The latest bombshell from US President Donald Trump rattled financial markets, triggering a sharp sell-off across US equities and European automotive stocks. General Motors took a notable hit in pre-market trading, sliding 6%, while Tesla managed to edge higher. However, by mid-morning in London, both European indices and US futures staged a modest recovery. Whether this rebound can evolve into something more sustained remains to be seen. Much now hinges on Trump’s rhetoric—should he soften his tone, markets might find some relief. If not, the risk of prolonged volatility looms large, particularly as April 2 approaches—a date dubbed “liberation day” by Trump. So, the near-term Nasdaq 100 forecast remains uncertain and dependent on Trump’s rhetoric.
Trade war takes centre stage
Yesterday, Trump signed an executive order imposing a 25% tariff on auto imports, intensifying the ongoing trade conflict under the guise of strengthening domestic industry. This move sets the stage for further tariff measures next week, including the introduction of so-called reciprocal tariffs on 2nd April – an escalation likely to exacerbate tensions with key trade partners.
The president also hinted at additional levies on the European Union and Canada, should they collaborate in ways he perceives as economically detrimental to the US. At the same time, he signalled a potential relaxation of tariffs on China—albeit contingent on Beijing facilitating the sale of TikTok’s US operations to an American firm. Is this classic deal-making or yet another episode of market turbulence? Either way, investors are keeping a wary eye on developments.
European stocks endured a brutal session, with the auto sector bearing the brunt of the damage. Porsche and Mercedes-Benz Group were among the hardest hit, as Bloomberg reported an estimated €3.4 billion impact from the fresh US levies. Concerns over the broader economic consequences of the trade spat could undermine investor confidence and weigh on markets for a while yet.
Nasdaq 100 forecast: Technical analysis and trade ideas
Source: TradingView.com
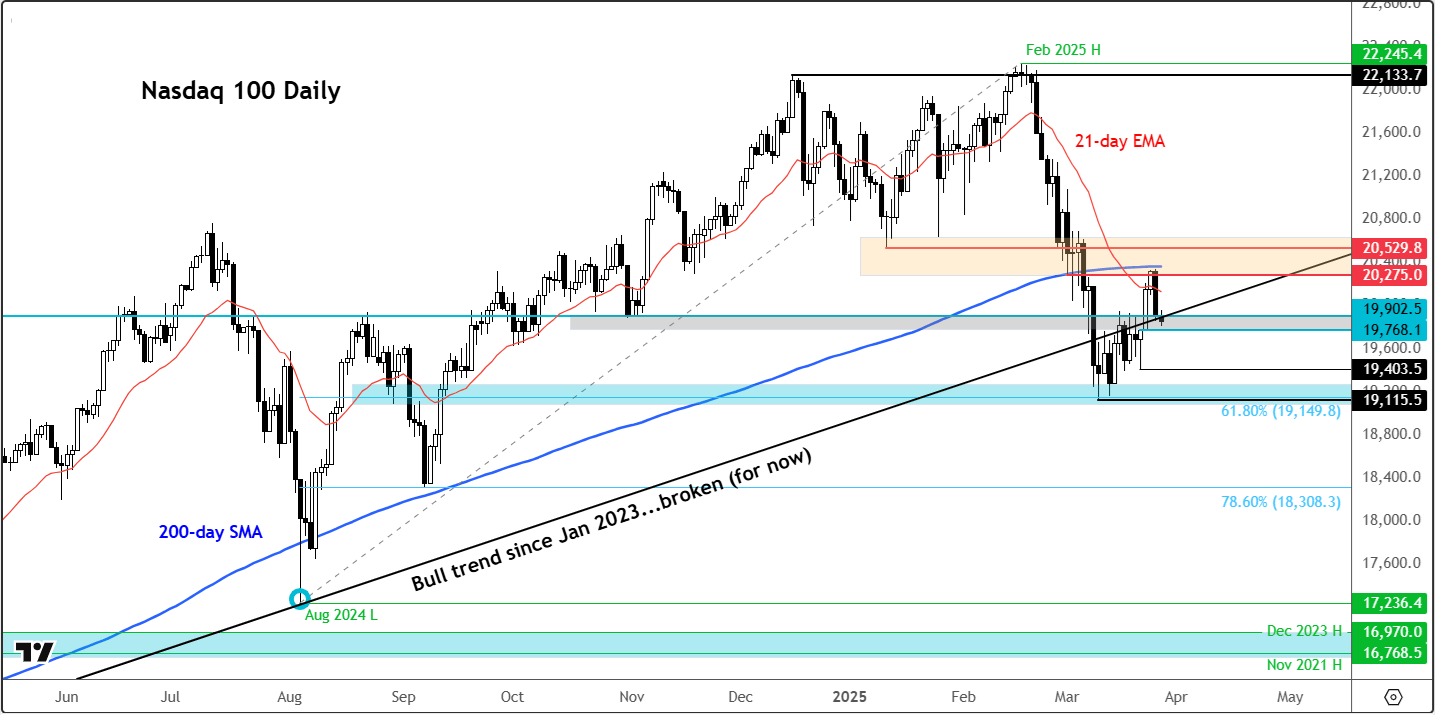
From a technical perspective, the Nasdaq 100 remains vulnerable, despite futures finding some support following yesterday’s sharp decline. Several major indices, including Germany’s DAX, have broken key support levels, and the Nasdaq 100 has also slipped below short-term technical barriers. This raises the prospect of a renewed downtrend, following the decent recovery seen earlier this month.
On the daily chart, the Nasdaq 100 has found support around top end of the 19768 - 19,900 range. This area represents a former resistance-turned-support zone, as well as the long-term bullish trend line that was briefly breached before being reclaimed. Additionally, this level aligns with the low prior to the post-election rally base, further reinforcing its importance. Whether this support holds or fails will likely dictate near-term direction.
Key technical levels to watch
- Support levels: A decisive break below the 19768 - 19,900 range could see the index slide towards 19,520, with further downside risk towards last Friday’s low of 19,403. Should selling pressure intensify, the broader 19,100-19,200 support zone may come into focus again.
- Resistance levels: The 19,944 mark serves as an immediate hurdle, representing last week’s high, when the Nasdaq 100 formed an inside bar pattern, breaking a four-week losing streak. Failure to sustain gains above this level could see the index dip below last week’s low of 19,392 in search of liquidity. Should the bulls defend the 19,900 level and maintain the bullish trend line, despite the prevailing trade war anxieties, it would suggest underlying strength in the market. In that scenario, a retest of the 200-day moving average could be on the cards.
The bottom line
In summary, 19,900 area remains the key battleground. A convincing break lower would signal further downside, while a successful defence of this level could set the stage for a renewed push higher. Traders should remain vigilant, as geopolitical risks continue to dictate the Nasdaq 100 forecast and market sentiment generally.
-- Written by Fawad Razaqzada, Market Analyst
Follow Fawad on Twitter @Trader_F_R
How to trade with City Index
You can trade with City Index by following these four easy steps:
- Open an account, or log in if you’re already a customer
• Open an account in the UK
• Open an account in Australia
• Open an account in Singapore
- Search for the company you want to trade in our award-winning platform
- Choose your position and size, and your stop and limit levels
- Place the trade
Related tags:




The complete CFD trading experience
Award-winning platforms, competitive spreads, low commissions and dedicated support.
We live and breathe the markets and are dedicated to helping traders realise their ambitions as we continue to set the industry bar.
Economic calendar
Web Trader platform
Our sophisticated web-based platform is packed with features.
Related articles

AUD/USD outlook: Aussie slips despite hawkish RBA ahead of key data
The AUD/USD was unable to benefit from the Reserve Bank of Australia’s 25-basis-point rate hike overnight. The RBA lifted the cash rate to 4.60%, in line with expectations. However, the Australian dollar weakened following the decision, with much of the Bank’s hawkish stance seemingly priced in ahead of the announcement. The US dollar has also remained largely supported following the recent turmoil in the bond markets.

RBA delivers 25bp hike, Bullock now the main event
The RBA delivered the expected 25bp hike, but Bullock’s press conference now looms as the bigger volatility risk for AUD/USD and the ASX 200.

Gold outlook: XAU/USD hammered, stretched and vulnerable to a sharp rebound
Gold is getting hammered for solid fundamental reasons, but history suggests extreme four-hourly oversold conditions can produce violent countertrend rallies.
StoneX Europe Ltd may make third party material available on this website which may contain information included but not limited to the conditions of financial markets. The material is for information purposes only and does not contain, and should not be construed as containing, investment advice and/or investment recommendation and/or an investment research and/or an offer of or solicitation for any transactions in financial instruments; any decision to enter into a specific transaction shall be made by the client following an assessment by him/her of their situation.
StoneX Europe Ltd makes no representation or warranty and assumes no liability as to the accuracy or completeness of the information provided, nor any loss arising from any investment based on a recommendation, forecast or other information supplied. You should always seek independent advice as to your suitability to speculate in any related markets and your ability to assume the associated risks, if you are at all unsure. We are not under any obligation to update any such material. Any opinion made may be personal to the author and may not reflect the opinion of StoneX Europe Ltd.