



Nasdaq Could Look to KOSPI for Directional Clues Beyond Earnings
The KOSPI is testing a major support level that could offer directional clues for the Nasdaq and Nikkei as earnings season gets underway.
Share this:

The KOSPI's sharp selloff has become a key barometer for global technology sentiment, given South Korea's central role in the AI semiconductor supply chain through Samsung Electronics and SK Hynix. Now more than 30% below its record high, the index has been hit by a broad unwind in AI-related stocks, concerns over the outlook for chip demand, and a surprise rate hike from the Bank of Korea
The weakness has spilled over into regional equity markets, with the Nikkei 225 proving more sensitive to the semiconductor-led selloff than the Nasdaq in recent weeks. Wall Street indices have also come under pressure as earnings season gets underway. Against that backdrop, the KOSPI is attempting to hold a key technical support level. Whether buyers can defend it or bears force a decisive break lower, could prove pivotal for technology sentiment and broader equity markets.
View related analysis:
View related analysis:
KOSPI Tests Major Support After Sharp Selloff
The weekly chart shows the KOSPI has fallen for four consecutive weeks and is on track for a fifth. It has not recorded a five-week losing streak since August 2024, with bearish runs typically ending after two to three weeks over the past couple of years. With the RSI (2) deeply oversold and prices holding above the February high, dip buyers may be waiting in the wings.
The daily chart shows a bullish divergence on the RSI (2), while prices continue to hold above last week's bullish pinbar low. Buyers have also stepped in today to lift the KOSPI back above 6,500.
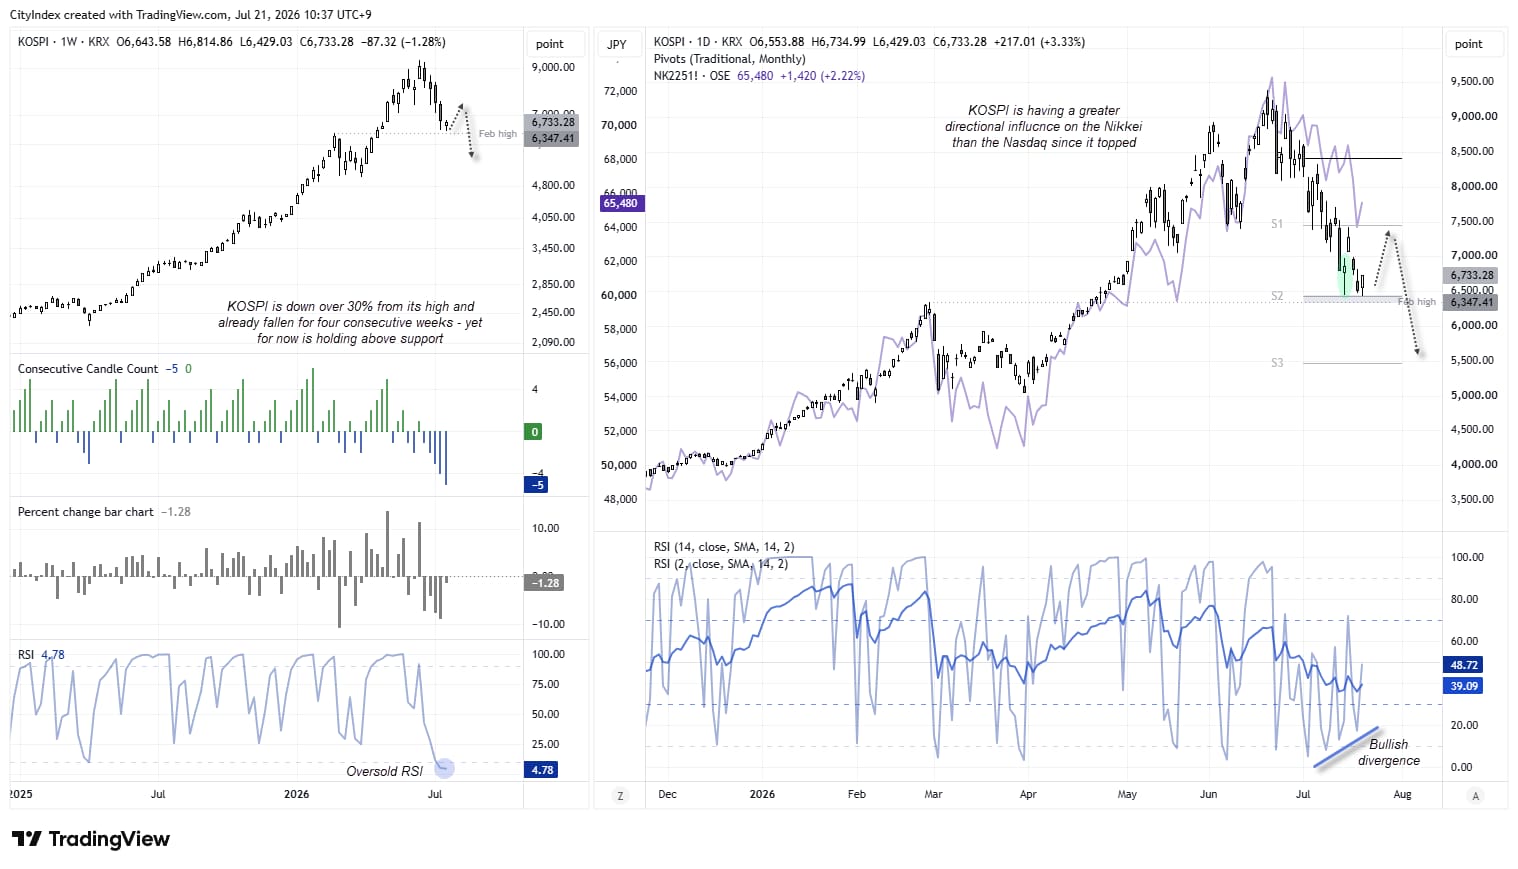
Source: KRK, TradingView


Nasdaq 100 Futures (NQ) Technical Analysis
The weekly chart shows prices remain in the lower half of last week's bearish candle. Notice that volatility has favoured bears since June, with the three largest candle bodies all to the downside at around 4%. The June low (28,227) is a key support level for bears to monitor, as a break beneath it would also see prices slip below the 20-week EMA and suggest a deeper correction is underway. The next major support level is the October high (26,399), although the monthly S2 pivot point near the 27,000 handle could provide interim support if a deeper pullback unfolds.
Volatility has favoured bears since June, with the three largest weekly candle bodies all to the downside at around 4%. While the Nasdaq's pullback has been far less severe, whether prices retest the June low or rebound from current levels may ultimately depend on whether KOSPI bulls can defend their own key support level.
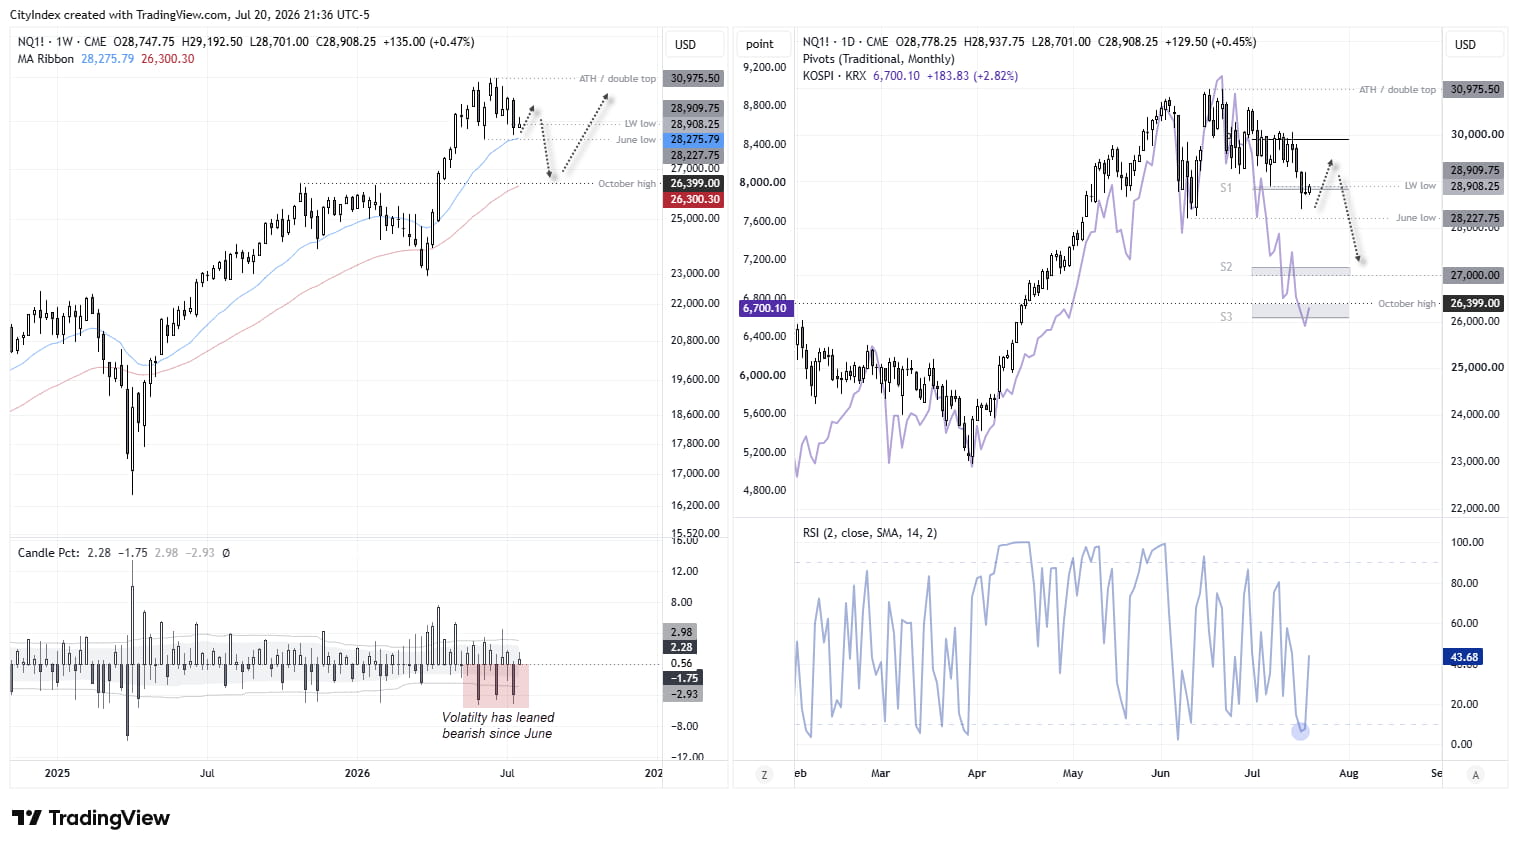
Source: CME, TradingView
Nasdaq 100 intraday Levels
Momentum has been moving predominantly lower on the 4-hour chart, although prices are grinding higher as part of a countertrend move. If the Nasdaq breaks above its weekly pivot point and the daily R1 near 28,900, the 29,100 low and weekly R2 pivot come into view. This could provide a potential resistance zone for bears to fade into or look for evidence of a swing high, on the assumption another leg lower unfolds. The June low could then come back into focus, with a break below it suggesting a deeper pullback is underway.
Risks to my downside bias include stronger-than-expected earnings and a solid rebound in the KOSPI.
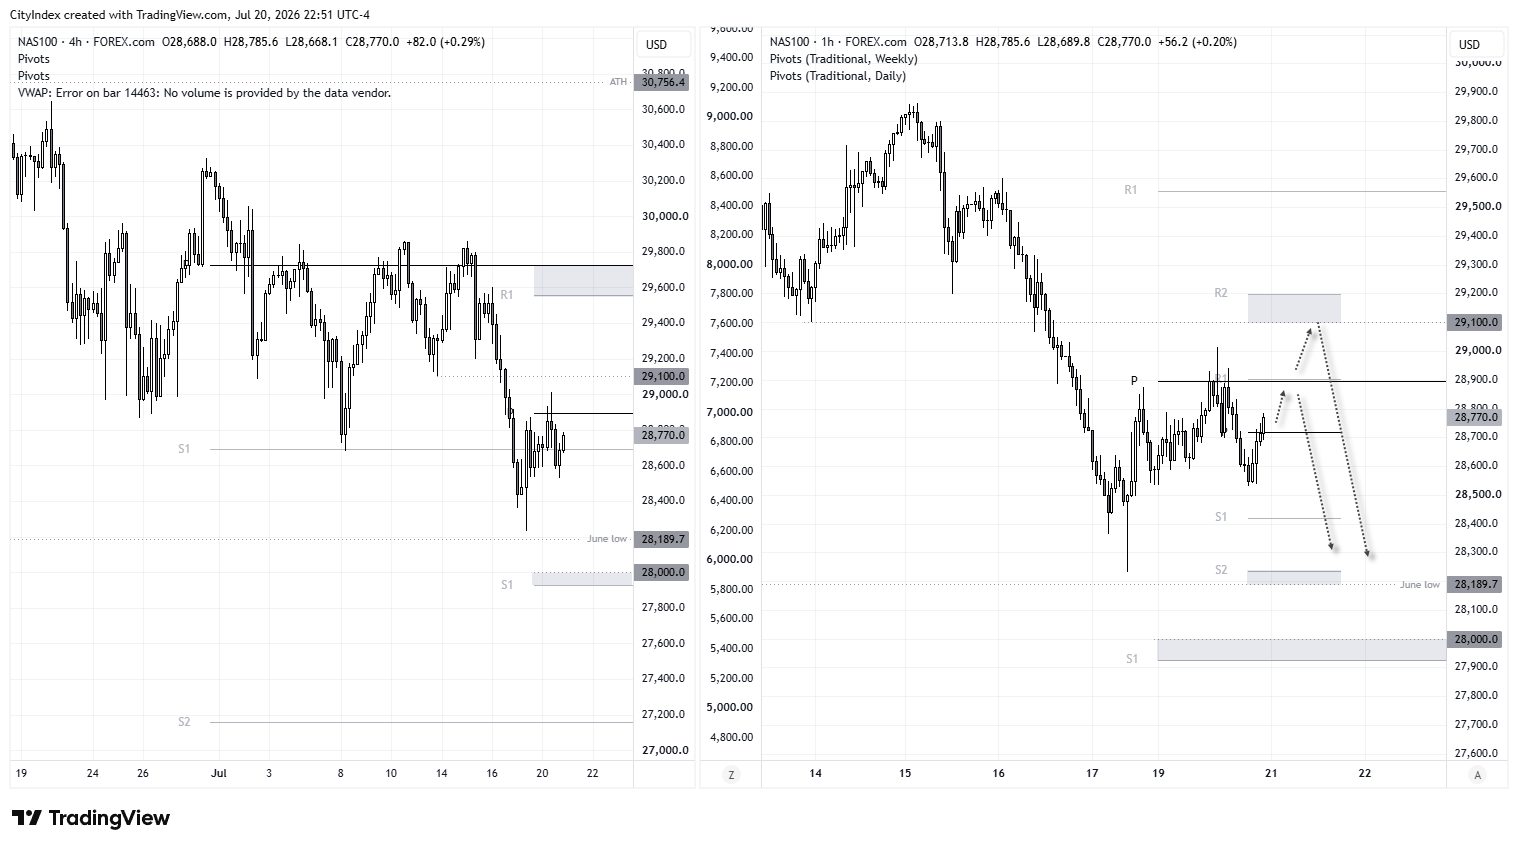
Source: Forex.com, TradingView
View the full economic calendar
View the full economic calendar
-- Written by Matt Simpson
Follow Matt on Twitter @cLeverEdge
How to trade with City Index
You can trade with City Index by following these four easy steps:
- Open an account, or log in if you’re already a customer
• Open an account in the UK
• Open an account in Australia
• Open an account in Singapore
- Search for the market you want to trade in our award-winning platform
- Choose your position and size, and your stop and limit levels
- Place the trade
Related tags:
Latest market news




The complete CFD trading experience
Award-winning platforms, competitive spreads, low commissions and dedicated support.
We live and breathe the markets and are dedicated to helping traders realise their ambitions as we continue to set the industry bar.
Economic calendar
Web Trader platform
Our sophisticated web-based platform is packed with features.
Related articles
Silver forecast: metals liquidation drags XAG/USD into $50-55 support
Silver has broken its July low and slipped into a long-term support zone as the selling in precious metals deepens. The chart shows where the metal could bottom, and next week's Fed decision may decide whether it does.


Nasdaq 100 Forecast: NDX Falls as the tech rout continues and oil prices soar
U.S. stocks are pointing to a modestly lower open after a sharp AI sell-off yesterday, as telecom stocks slide. Brent rises towards $115 adding to inflation pressures ahead of the FOMC rate decision.


S&P 500 forecast: AI linked stocks remain under pressure
And just like that, it is Friday again and the end of a volatile week. Today offers little on the macro calendar to change the prevailing narrative, leaving markets largely at the mercy of risk appetite, oil prices and the growing unease around the AI trade.
StoneX Europe Ltd may make third party material available on this website which may contain information included but not limited to the conditions of financial markets. The material is for information purposes only and does not contain, and should not be construed as containing, investment advice and/or investment recommendation and/or an investment research and/or an offer of or solicitation for any transactions in financial instruments; any decision to enter into a specific transaction shall be made by the client following an assessment by him/her of their situation.
StoneX Europe Ltd makes no representation or warranty and assumes no liability as to the accuracy or completeness of the information provided, nor any loss arising from any investment based on a recommendation, forecast or other information supplied. You should always seek independent advice as to your suitability to speculate in any related markets and your ability to assume the associated risks, if you are at all unsure. We are not under any obligation to update any such material. Any opinion made may be personal to the author and may not reflect the opinion of StoneX Europe Ltd.