



Nikkei, ASX 200, gold: TACO hopes power Asia bounce, downside asymmetry builds
Nikkei, ASX 200 and gold partially reverse early losses as TACO expectations build, but the setup now points to asymmetric downside risk if those hopes are disappointed
Share this:

- Asia bounce builds on TACO hopes
- Deadline keeps reversal window open
- Downside skew if TACO fails
Asia bounce builds on TACO hopes
Sharp losses in the Nikkei 225, ASX 200 and gold sparked by developments surrounding the Iran war have started to reverse during the Asian session on Monday, continuing the recent pattern of riskier asset classes fading an escalation in geopolitical tensions.
Over the weekend, peace talks between the US and Iran in Pakistan collapsed, with Donald Trump responding by threatening a full blockade of the Strait of Hormuz, saying the US would move “effective immediately”. That saw crude gap higher on the open, while the US dollar caught a bid and risk assets came under pressure as last week’s optimism around a deal was unwound.
However, the blockade isn’t set to begin until 10am US Eastern time on Monday, a familiar delayed deadline that has repeatedly allowed time for TACO-style reversals. Since the war began, similar weekend escalations have regularly been followed by a softening in tone from Trump or headlines pointing to de-escalation, often wiping out the initial move.
That pattern may help explain what we’ve seen so far today, with early losses in equities and gold already starting to unwind in Asia as markets weigh the risk of another reversal before the deadline hits. With price action already shifting towards another possible TACO, it arguably leaves directional risks skewed to the downside should it fail to materialise.
Nikkei 225: clean range to focus on
Source: TradingView
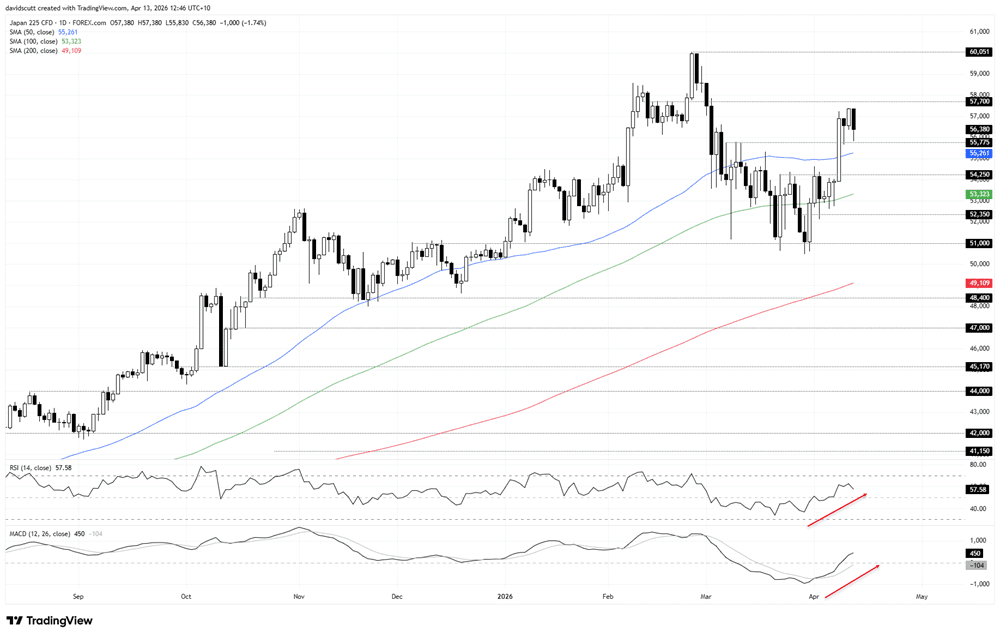
We have a very clean technical picture to work with in our Nikkei 225 contract, with the price bouncing hard from 55775 earlier Monday, a level that has acted as both support and resistance over the past month. Overhead, 57250 has capped bullish probes over the past week, creating a range for traders to focus on when assessing potential setups.
Should the geopolitical situation deteriorate further, a break of 55775 would put the 50DMA and former resistance at 54250 on the menu as potential targets for bears. For bulls, 57700 is the key level overhead should the reversal gain momentum. It has acted as support and resistance previously, making price action at that level important should it return there, with little in the way of resistance until the record highs at 60051.
The message from the oscillators favours a bullish bias, with RSI (14) still trending higher above 50 while MACD has flipped positive, having crossed the signal line from below at the start of April.
ASX 200: 8900 holds
Source: TradingView
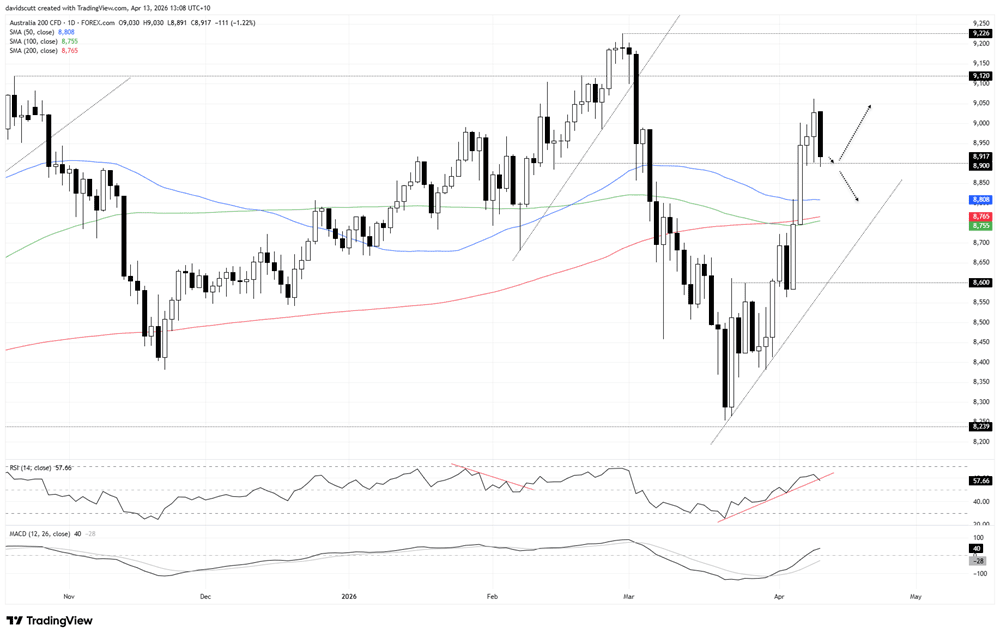
The bounce in our ASX 200 contract has been less pronounced than the Nikkei’s so far, although it’s notable it started after a failed bearish break beneath 8900. We’ve seen several downside moves fizzle at that level in recent days, making it the immediate focus below where the price now trades, acting as a barrier preventing a deeper flush towards the cluster of the 50, 100 and 200DMAs layered between 8808 and 8755. Of the three, it’s noticeable the price has been more responsive to the 50DMA than longer-term price action recently.
A clean break beneath that cluster would put 8600 in focus for bears. Should bids beneath 8900 continue to thwart downside, Friday’s high above 9050 deserves attention if the bounce builds later in the session, with a break there leaving only 9120 standing between a retest of the record high at 9226.
The oscillators marginally favour a bullish bias, although in this environment more weight should be placed on price action rather than holding a firm directional view.
Gold: failed break fuels rebound
Source: TradingView
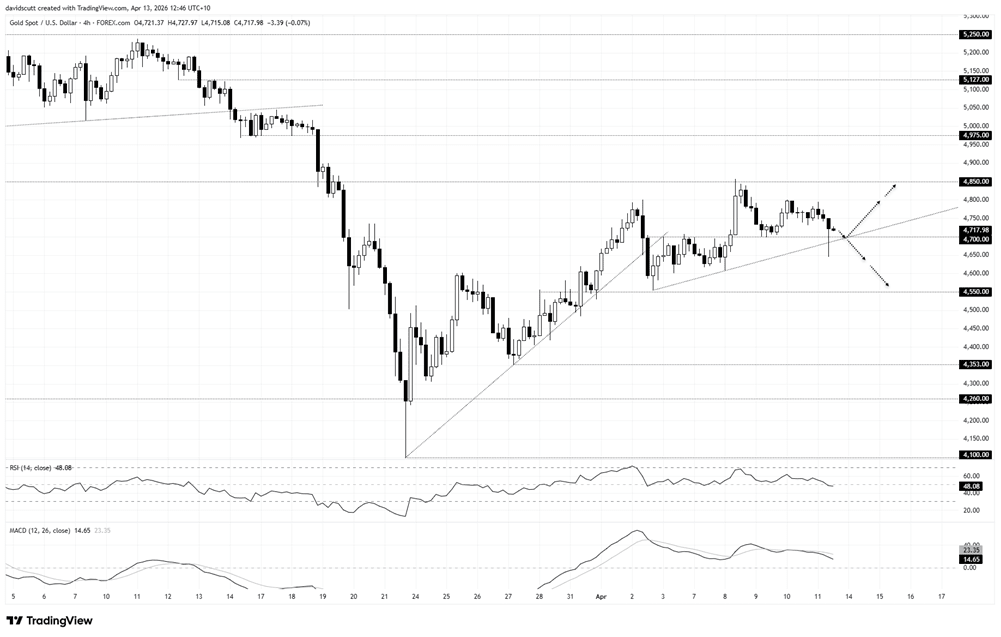
Of the three markets being looked at, the most pronounced reversal has so far come from gold, with the price bouncing hard after dipping beneath $4650 in early deals on Monday. With $4700 having acted as support and resistance on the H4 chart earlier this month, the failed bearish break beneath it earlier today suggests bids are lurking there, making it a reference point to focus on should we see a retracement heading into European trade.
Beneath Monday’s session low, the price found buyers just ahead of $4500 earlier this month, although $4550 is the more pronounced level, having seen bulls and bears slug it out there late last month.
Should the bounce extend further, offers have emerged on rallies towards $4800 in recent days, preventing a retest of the February 17 low at $4850 which flipped to offering resistance earlier this month.
The message from RSI (14) and MACD on the H4 timeframe is neutral, with the upside strength seen through much of April now fading. RSI has edged below 50 while MACD has crossed the signal line from above and is rolling over. Price action at known levels should therefore take precedence when assessing setups.
Latest market news




The complete CFD trading experience
Award-winning platforms, competitive spreads, low commissions and dedicated support.
We live and breathe the markets and are dedicated to helping traders realise their ambitions as we continue to set the industry bar.
Economic calendar
Web Trader platform
Our sophisticated web-based platform is packed with features.
Related articles
EUR/USD weekly outlook: FOMC and ECB to set the tone
The current backdrop is modestly bearish. On Friday, the EUR/USD closed modestly lower, down for the third consecutive day. The pair also posted a weekly decline after staging a modest recovery attempt in the previous week. Out of the past 8 weeks, the EUR/USD has fallen on 6 occasions. There is not much supporting factors for the single currency right now. So, the upside remains capped.
S&P 500, Nasdaq, Dow Forecast: Nasdaq Selloff Deepens as Dow Rally Stalls 10 24 2026
A failed S&P breakout and looming Nasdaq support test raise the stakes for next week’s Fed decision and October’s monthly close.

Gold Does Something it Hasn’t Done in a Year, is Larger Risk-Off Afoot?
With tech stocks getting hit harder last week there was collateral damage elsewhere, including gold as the metal closed below the $4k level for the week and that’s the first time that’s happened to spot gold in more than a year.

StoneX Europe Ltd may make third party material available on this website which may contain information included but not limited to the conditions of financial markets. The material is for information purposes only and does not contain, and should not be construed as containing, investment advice and/or investment recommendation and/or an investment research and/or an offer of or solicitation for any transactions in financial instruments; any decision to enter into a specific transaction shall be made by the client following an assessment by him/her of their situation.
StoneX Europe Ltd makes no representation or warranty and assumes no liability as to the accuracy or completeness of the information provided, nor any loss arising from any investment based on a recommendation, forecast or other information supplied. You should always seek independent advice as to your suitability to speculate in any related markets and your ability to assume the associated risks, if you are at all unsure. We are not under any obligation to update any such material. Any opinion made may be personal to the author and may not reflect the opinion of StoneX Europe Ltd.