



Nikkei under the pump as macro and technicals align
Correlations point to rising sensitivity to energy and risk, while price action shows a market losing momentum with 51000 under pressure.
Share this:

- Macro backdrop deteriorating as energy and fiscal risks build
- Technicals weakening with lower highs and soft momentum
- 51000 a key level that may determine the next move
Fundamentals and technicals are starting to align, and the message is clear: the Nikkei looks vulnerable to the risk of a deeper and more protracted unwind.
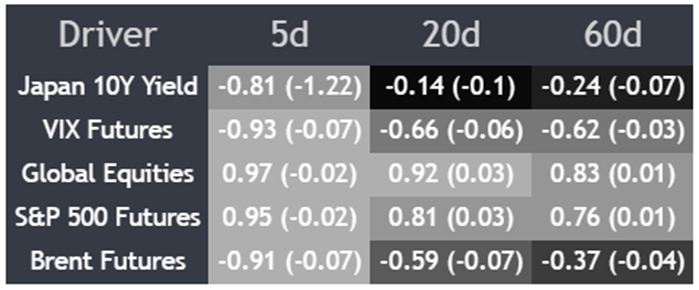
Looking at correlations over the past week, it suggests the index remains at the whim of developments in the Middle East. The extremely strong positive relationship with global equities, proxied by Vanguard’s Total World ETF, and S&P 500 futures remains across timeframes, while the inverse correlation with VIX has firmed noticeably.
Source: TradingView
But what stands out is the sensitivity to energy and rates. The relationship with Brent and long-end JGB yields highlights how exposed the Nikkei has become to swings in energy prices and the broader macro backdrop.
It’s essentially a risk indicator with Japanese characteristics, driven by sentiment around energy.
And that’s where the fundamental vulnerability sits.
As outlined in our Q2 USD/JPY outlook guide, higher oil prices driven by the Iran conflict are hitting Japan’s terms of trade, lifting import costs, squeezing margins, and raising concerns about the fiscal outlook, and that’s even before the potential for a sustained energy supply shock is considered.
For an equity market dominated by export-heavy industrials, it’s not a great mix. And that’s being borne out on the charts.
Source: TradingView
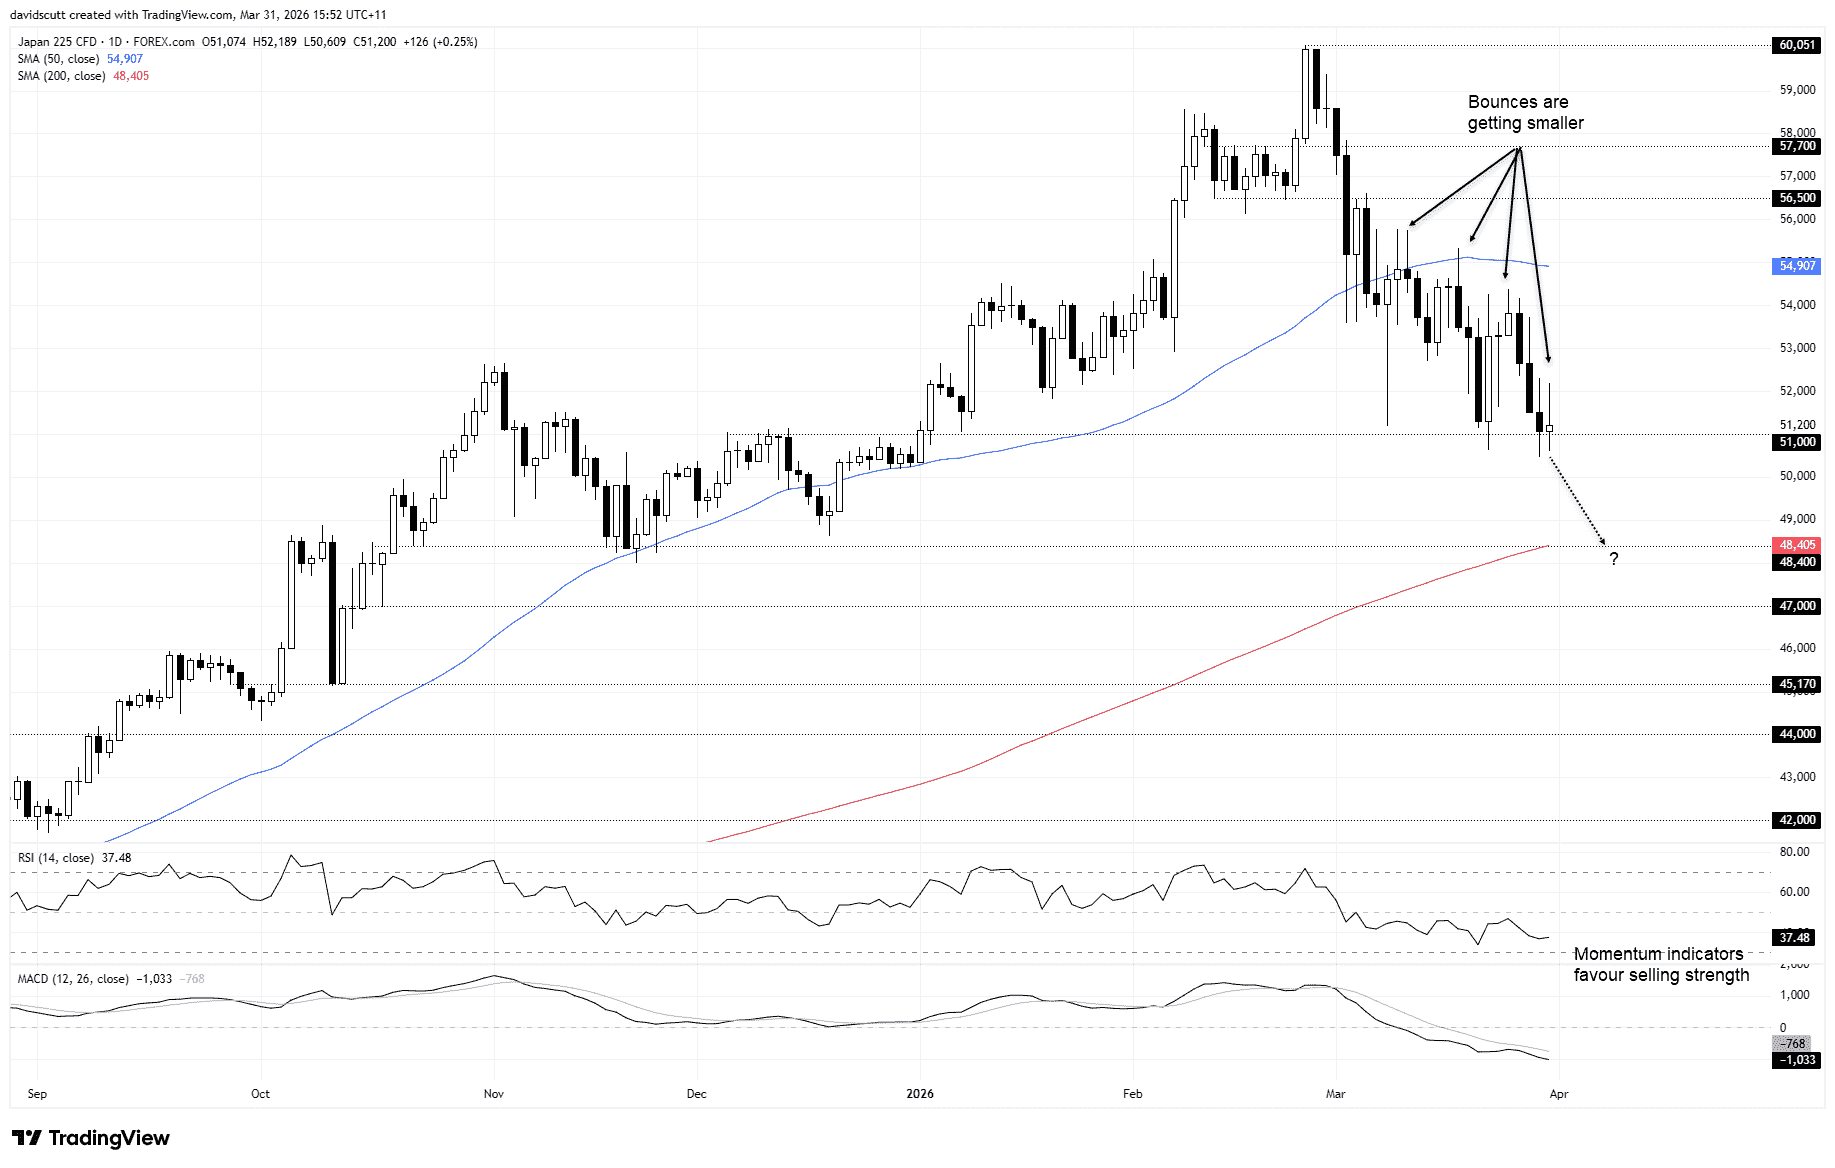
51000 is the line in the sand for Nikkei bulls. Defend it, or risk enticing more participants into the unwind already seen.
We’ve seen multiple bearish break attempts in March, all of which have failed. But the telling thing is the string of lower highs from bounces, sequentially failing around the 50DMA and, more recently, ahead of 54000. The index looks heavy.
RSI (14) is yet to set lower lows but remains below 50, indicating downside pressure remains in the ascendancy, a signal backed up by MACD which is motoring lower in negative territory.
Risks are therefore tilted to the downside, but they are unlikely to be acted upon until we see a definitive break, ideally accompanied by a close. Otherwise, it risks being just another failed break, potentially paving the way for a retest of sellers parked above 54000.
A sustained break of 51000 would allow for a stop to be placed above the level for protection, targeting the intersection of 48500 support and the 200DMA.
Latest market news



The complete CFD trading experience
Award-winning platforms, competitive spreads, low commissions and dedicated support.
We live and breathe the markets and are dedicated to helping traders realise their ambitions as we continue to set the industry bar.
Economic calendar
Web Trader platform
Our sophisticated web-based platform is packed with features.
Related articles
S&P 500 forecast: Stocks extend drop as correction risks grow
US and global equity markets have extended Wednesday’s sell-off, with Wall Street opening lower after a weak handover from Asia and Europe. The deterioration in risk appetite has been spreading across global markets. The dollar was firmer, Treasury yields were holding onto yesterday’s gains, while gold, silver and bitcoin were all under pressure alongside equities and major currencies.
GBP/USD, DJIA Outlook: Support Levels Meet Oversold Risks
GBP/USD and the Dow test key support levels as rising Treasury yields, Fed rate-hike expectations and oversold momentum increase reversal risks.

Gold forecast: XAU/USD could take a larger dive after the big rise in yields
Gold prices have been falling in the last few days after last week’s post-FOMC pop faded amid rising interest rate expectations, higher oil prices and a strengthening US dollar. As before, I wasn’t convinced gold would thrive in the current macro backdrop.
StoneX Europe Ltd may make third party material available on this website which may contain information included but not limited to the conditions of financial markets. The material is for information purposes only and does not contain, and should not be construed as containing, investment advice and/or investment recommendation and/or an investment research and/or an offer of or solicitation for any transactions in financial instruments; any decision to enter into a specific transaction shall be made by the client following an assessment by him/her of their situation.
StoneX Europe Ltd makes no representation or warranty and assumes no liability as to the accuracy or completeness of the information provided, nor any loss arising from any investment based on a recommendation, forecast or other information supplied. You should always seek independent advice as to your suitability to speculate in any related markets and your ability to assume the associated risks, if you are at all unsure. We are not under any obligation to update any such material. Any opinion made may be personal to the author and may not reflect the opinion of StoneX Europe Ltd.