



NVIDIA Earnings: All Eyes on Guidance, Margins and Data Centers
NVIDIA reports earnings at a pivotal moment for the AI sector. Revenue is expected to climb close to $109 billion, marking another quarter of extraordinary growth, but investors are increasingly focused on what comes next. With margins under pressure, AI valuations being reassessed and leadership uncertainty following Jensen Huang's departure, guidance for 2027 and management's outlook on data-center demand could prove far more important than the headline numbers.
Share this:

NVIDIA (NVDA) Earnings Outlook
NVIDIA reports fiscal Q3 2027 results after the U.S. close on November 17, 2026. The central setup is a company guided to roughly $108 billion of revenue, against a Street consensus near $109.1 billion and $2.47 non-GAAP EPS—implying another substantial beat is required to sustain the market’s elevated expectations in the current AI selloff.
1. Investment Thesis
NVIDIA remains the principal monetization vehicle for AI data-center capex, with its latest reported quarter—fiscal Q2 2027, ended July 26, 2026—producing revenue of $96.22 billion, up 106% year over year and 18% sequentially. Data Center revenue reached $89.0 billion, up 117% year over year, highlighting that the company’s growth remains overwhelmingly infrastructure-led rather than diversified across end markets.
The investment question is no longer whether NVIDIA can grow; it is whether the magnitude, durability, and margin quality of that growth can justify the valuation and positioning embedded in the shares. Management has guided fiscal Q3 revenue to $108.0 billion, plus or minus 2%, while signaling gross margin of 74.0%, plus or minus 50 basis points; it has also indicated that gross margin may trough at 71%–72% in the following January quarter because of higher memory costs.
The asymmetry lies around guidance, gross margin, and the forward-quarter outlook, rather than the headline revenue print alone.
2. Eight-Quarter Operating Record
The following table uses NVIDIA’s reported quarterly results. Revenue is in billions of U.S. dollars; EPS is non-GAAP diluted EPS, the measure most relevant to consensus comparisons and trading expectations.
|
Fiscal quarter |
Report date |
Revenue ($B) |
Revenue QoQ |
Revenue YoY |
Non-GAAP EPS |
EPS QoQ |
EPS YoY |
|
Q3 FY25 |
Nov. 20, 2024 |
35.08 |
17% |
94% |
$0.81 |
17% |
103% |
|
Q4 FY25 |
Feb. 26, 2025 |
39.33 |
12% |
78% |
$0.89 |
10% |
82% |
|
Q1 FY26 |
May 28, 2025 |
44.06 |
12% |
69% |
$0.81 |
-9% |
121% |
|
Q2 FY26 |
Aug. 27, 2025 |
46.74 |
6% |
56% |
$1.05 |
30% |
152% |
|
Q3 FY26 |
Nov. 19, 2025 |
57.01 |
22% |
62% |
$1.30 |
24% |
60% |
|
Q4 FY26 |
Feb. 25, 2026 |
68.13 |
20% |
73% |
$1.62 |
25% |
82% |
|
Q1 FY27 |
May 20, 2026 |
81.62 |
20% |
85% |
$1.87 |
15% |
131% |
|
Q2 FY27 |
Aug. 26, 2026 |
96.22 |
18% |
106% |
$2.22 |
19% |
111% |
Sources: NVIDIA earnings releases and MarketBeat’s reported-versus-estimate history; sequential and year-over-year percentages are calculated from the reported figures above.
What the record shows
- Revenue has risen in each of the past eight reported quarters, from $35.08 billion in fiscal Q3 2025 to $96.22 billion in fiscal Q2 2027—an increase of approximately 174% over that span.
- Sequential revenue growth reaccelerated sharply after the fiscal Q2 2026 deceleration: from 6% QoQ in that quarter to 22%, 20%, 20%, and 18% in the subsequent four quarters.
- Non-GAAP EPS growth has remained exceptionally strong, though the Q1 FY26 sequential EPS decline illustrates the sensitivity of reported profitability to margins, operating expenses, tax effects, and quarter-specific items.
- The latest quarter’s $96.22 billion revenue and $2.22 non-GAAP EPS exceeded consensus estimates of $92.27 billion and $2.09, respectively, extending NVIDIA’s recent pattern of positive surprises.
3. Current Expectations
For fiscal Q3 2027, the market is positioned for another very large sequential and year-over-year acceleration.
|
Metric |
Management guidance / market expectation |
Interpretation |
|
Revenue guidance |
$108.0B, +/- 2% |
Implies roughly 89% YoY growth versus Q3 FY26 revenue of $57.01B. |
|
Street revenue consensus |
$109.08B |
About $1.1B, or roughly 1%, above the midpoint of management guidance. |
|
Street non-GAAP EPS consensus |
$2.47 |
Represents approximately 90% YoY EPS growth versus $1.30 in Q3 FY26. |
|
Gross-margin guidance |
74.0%, +/- 50 bps |
A modest sequential decline from the prior quarter’s reported 75% gross margin. |
|
Next-quarter margin signal |
71%–72% potential trough |
Management has flagged margin pressure into the January quarter, making cost and pricing commentary very important at this release. |
|
Full-year FY2027 consensus EPS |
$9.28 |
Reflects continued analyst confidence in sustained earnings power. |
The most important comparison is consensus versus guidance: at approximately $109.08 billion, the Street is already above the $108.0 billion guidance midpoint. Thus, merely meeting the guidance midpoint may not be received as a clean beat.
4. Key Catalysts and Risks
Bull case
- Demand visibility: Data Center revenue of $89.0 billion in fiscal Q2 2027, up 117% year over year, indicates that AI accelerator demand remains the dominant earnings driver.
- Guidance upside: A revenue guide materially above $108 billion, particularly if paired with better-than-feared gross margin, would validate the Street’s above-guidance consensus.
- Earnings power: The company has beaten consensus EPS in most of the recent quarters shown above, including the latest quarter’s $0.13 EPS beat.
- Capital-return support: NVIDIA’s board authorized a $150 billion share-repurchase program alongside the latest results, providing a potential support mechanism for the equity narrative.
Bear case
- Margin compression: Management’s indication that gross margin could fall to 71%–72% in the January quarter introduces a risk that revenue growth does not translate proportionally into EPS growth.
- High expectations: With consensus revenue already above the guidance midpoint, the bar for a positive stock reaction is high; an in-line quarter with conservative guidance could be interpreted as a growth deceleration signal.
- Customer concentration and AI capex cyclicality: NVIDIA’s results remain closely tied to hyperscaler and AI-infrastructure spending; therefore negative changes in deployment pacing, procurement timing, or customer financing could affect forward guidance.
- Leadership transition: NVIDIA announced on November 13, 2026 that Jensen Huang resigned as President, CEO, and board member, effective immediately. This is an unusually material governance event immediately preceding earnings and may increase the importance of management commentary and forward guidance. Attention will be given to who will follow and/or if Jensen is reinstated as CEO.
5. Trading Framework
The base case is that NVIDIA reports revenue near or modestly above $109 billion and non-GAAP EPS near $2.47, while guiding the January quarter to a level that tests whether the company can sustain triple-digit percentage revenue growth. The market’s stated expectation of approximately 92% year-over-year revenue growth for the fiscal third quarter implies that investors are still not pricing in a normalization of growth; they are pricing in a continuation.
|
Possible Scenario |
Potential financial outcome |
Market interpretation |
|
Bull |
Revenue above $109B; EPS at or above $2.47; January-quarter revenue guide above Street expectations; margin resilience |
Confirms accelerating AI-infrastructure demand and supports a re-rating |
|
Base |
Revenue around $108B–$109B; EPS near $2.47; guidance broadly consistent with consensus |
Likely viewed as adequate but not automatically bullish given the elevated setup |
|
Bear |
Revenue below $108B; EPS below $2.47; weakening January-quarter guide or gross-margin deterioration |
Raises concerns over demand pacing, pricing, memory costs, and valuation support |
6. Technical Analysis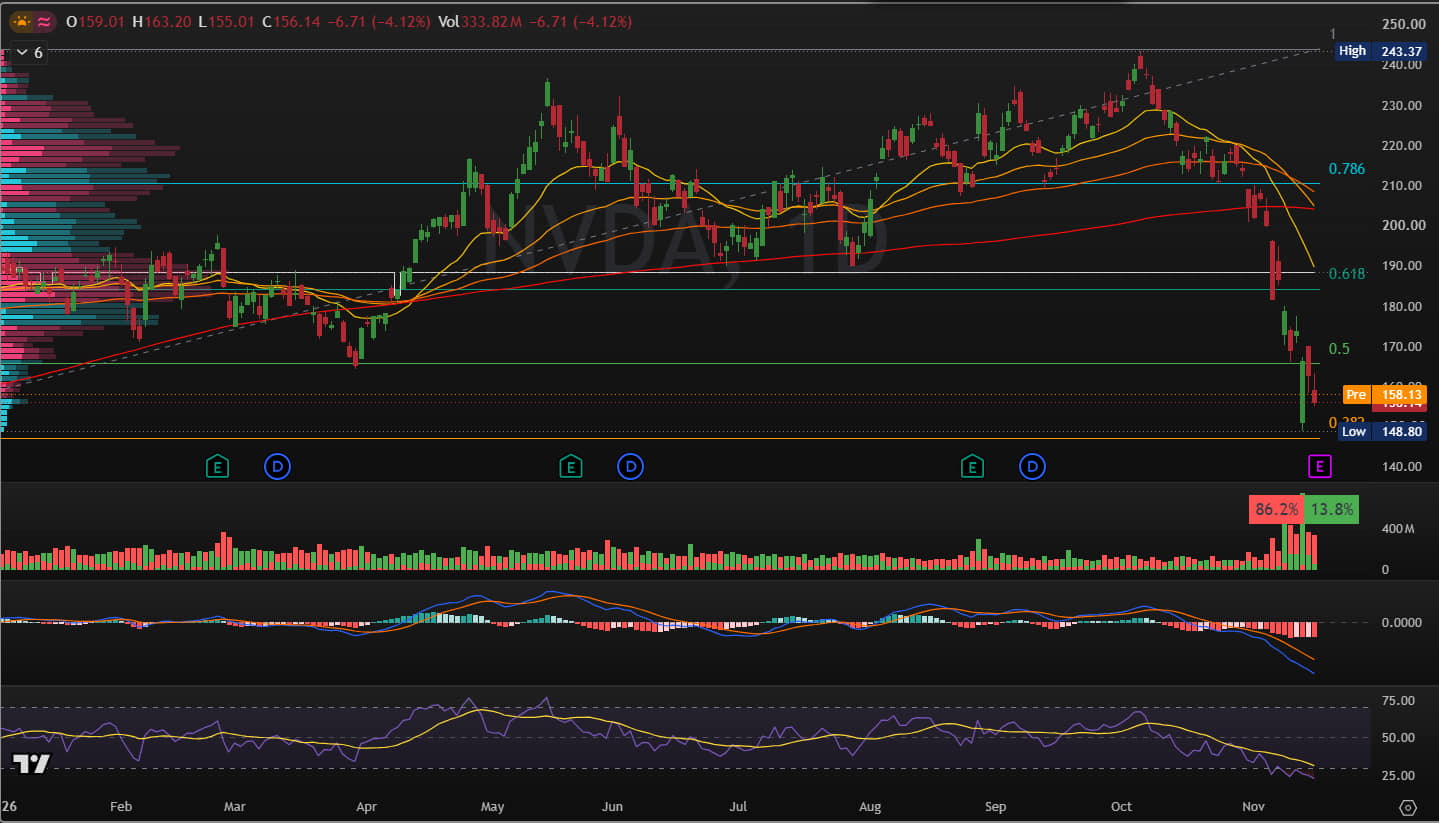
NVDA is trading near $154.80, about 36% below its all-time high of $243.37 and only around 4% above its 2026 low of $148.80 printed 2 days ago. The stock remains in a strong short-term downtrend that started on the 6th of October: it is currently below all major moving averages, the 50-day average has also crossed below the 200-day average, and the daily RSI has reached deeply oversold levels near 22.5–30.
Key resistance levels
- $155–$156: Immediate resistance; a move above this level would be the first sign of stabilization.
- $165–$171: The most important resistance zone. It includes the 50% retracement, the recent rebound high. A sustained close above $171 would be the first meaningful bullish reversal signal.
- $177.50–$180: The next resistance area if NVDA clears $171. Last week high and recovery attempts.
- $189.50–$190: A potential upside target in case of a stronger post-earnings rally, start of the bear gaps.
- $204–$215: Major long-term resistance from the 200-day moving averages. Reclaiming this zone would be necessary for a durable trend reversal.
Key support levels
- $148.80–$150: The critical support zone. It includes the 2026 low and the widely watched $149.09 floor. Holding this area is essential to avoid a further breakdown.
- $133–$135: The next major downside target if $148.80 breaks decisively. The May 2025 breakout zone.
- $122.33: A secondary downside level if selling accelerates beyond the $133–$135 zone. Breakout zone of 9th May.
- $100 and $86.62: Longer-term support references, relevant only in a severe continuation scenario. The 2025 support and lows, respectively.
Trade Setup
If NVDA closes below $148.80 on elevated volume, the bearish scenario becomes more credible, with $133–$135 as the next major target and $122 as a secondary level.
Volume is the key confirmation. The November 16 bounce occurred on much lower volume than the November 13 sell-off, which suggests short-covering or positioning rather than strong accumulation. A high-volume close above $171 could be a strong bullish confirmation; a high-volume close below $149 could be a strong bearish confirmation.
Summary
NVIDIA enters the print with a high reported momentum, because of eight consecutive quarters of revenue growth and a latest quarter growing 106% year over year. But consensus is already positioned above management’s guidance midpoint. The highest-value variables for traders could be the January-quarter revenue guide, gross-margin trajectory, Data Center demand commentary, and any clarity following the abrupt CEO transition Jensen Huang.
--Written by Philip Papageorgiou – Market Analyst
-Follow me on X ex Twitter: PhilipForexCom

The complete CFD trading experience
Award-winning platforms, competitive spreads, low commissions and dedicated support.
We live and breathe the markets and are dedicated to helping traders realise their ambitions as we continue to set the industry bar.
Economic calendar
Web Trader platform
Our sophisticated web-based platform is packed with features.
Related articles

NVIDIA Earnings: All Eyes on Guidance, Margins and Data Centers
NVIDIA reports earnings at a pivotal moment for the AI sector. Revenue is expected to climb close to $109 billion, marking another quarter of extraordinary growth, but investors are increasingly focused on what comes next. With margins under pressure, AI valuations being reassessed and leadership uncertainty following Jensen Huang's departure, guidance for 2027 and management's outlook on data-center demand could prove far more important than the headline numbers.

DAX Correction Deepens as AI Stocks Face Leadership Questions
The DAX has moved into a corrective phase after failing to hold recent highs near 27,000 points. Investors are turning more cautious ahead of NVIDIA's highly anticipated earnings report and the upcoming Anthropic IPO, two events that could determine whether confidence in the AI investment cycle remains intact. With European equities trading in risk-off mode, technology and growth stocks are once again at the center of market volatility.

US Dollar, Gold, Silver Outlook: 2026 Extremes and Key Levels to Watch
US Dollar, Gold, Silver Outlook: Major currency pairs and precious metals are testing 2026 extremes as markets price in a 25-basis-point Fed rate hike in December. However, stretched momentum indicators are bringing near-term reversal risks into focus.

StoneX Europe Ltd may make third party material available on this website which may contain information included but not limited to the conditions of financial markets. The material is for information purposes only and does not contain, and should not be construed as containing, investment advice and/or investment recommendation and/or an investment research and/or an offer of or solicitation for any transactions in financial instruments; any decision to enter into a specific transaction shall be made by the client following an assessment by him/her of their situation.
StoneX Europe Ltd makes no representation or warranty and assumes no liability as to the accuracy or completeness of the information provided, nor any loss arising from any investment based on a recommendation, forecast or other information supplied. You should always seek independent advice as to your suitability to speculate in any related markets and your ability to assume the associated risks, if you are at all unsure. We are not under any obligation to update any such material. Any opinion made may be personal to the author and may not reflect the opinion of StoneX Europe Ltd.