







NZD/USD and AUD/NZD Analysis: RBNZ Holds Rates, Technical Levels in Focus
RBNZ holds rates at 3.25% as expected, though a dovish bias remains. NZD/USD and AUD/NZD test key resistance, setting up pivotal technical moves.
Share this:

The Reserve Bank of New Zealand (RBNZ) held the official cash rate at 3.25% as expected, but its forward guidance leaned cautiously dovish. While further cuts remain possible if inflation pressures ease, global economic uncertainties—particularly Trump’s proposed tariffs—mean the central bank is also prepared to hold steady. With NZD/USD stalling at trend resistance and AUD/NZD nearing key reversal zones, the focus now shifts to upcoming CPI data and US macro drivers.
View related analysis:
View related analysis:
RBNZ Dovish Hold Puts NZD/USD and AUD/NZD at Pivotal Turning Points
There were no surprises from the Reserve Bank of New Zealand (RBNZ) today, as it kept its overnight cash rate (OCR) unchanged at 3.25%, as widely expected. However, it warned that the cash rate could be lowered further if inflationary pressures ease in line with expectations. At the same time, it left room to maintain rates at the current level, citing the economic uncertainties faced by policymakers due to Trump’s tariffs.
The RBNZ had cut rates at six consecutive meetings up to May, totalling 225bp across three 50bp cuts and three 25bp cuts. Given the strong hints dropped at the May meeting that the easing cycle may be nearing its end—and with recent economic data improving—a hold today appears to be the right call.
Consensus points to one more 25bp cut to 3% by December, with timing contingent on incoming data. Next week’s retail sales figures will certainly be worth watching, but the Q1 inflation data set due out on 21 July will be key for NZD/USD traders. CPI rose 0.3% q/q in the first quarter and 0% in Q4. While this seems low, it broke the trend of nine consecutive negative quarterly prints seen up to Q3. And with the RBNZ cautioning over higher inflation, I doubt it will be inclined to cut again in Q3 if prices continue to climb—even modestly.

Chart source: Serve Bank of New Zealand (RBNZ), LSEG Workspace
RBNZ Monetary Policy Review Statement Summary
• RBNZ held the cash rate at 3.25%
• CPI will likely increase towards the top of the 1-3% band over mid-2025
• Elevated export prices and lower interest rates are supporting a recovery in the New Zealand economy
• However, NZ economic recovery likely to slow due to global policy uncertainty and tariffs
• RBNZ could lower the cash rate further if medium-term inflation pressures ease as projected
NZD/USD Technical Analysis: New Zealand Dollar Stalls At Trend Resistance
NZD/USD has seen a decent rally from its late June low, although prices have now reached trend resistance from the April high. A small-bodied candle with a long upper wick formed yesterday, which suggests traders may be pausing for breath ahead of tomorrow’s Powell testimony and US CPI data on Thursday.
Of course, that doesn't rule out another jab higher—but if sellers are lurking near this trendline, then we may see NZD/USD roll over. A break beneath 0.6085 could provide an initial bearish signal, while a move below 0.6050 confirms a potential swing high.
Should we see a more bullish outcome, a break above the trendline and 0.6175 opens the door towards the 0.6217 high. However, with the New Zealand Dollar stalling at resistance and RSI (2) now above 90, there’s certainly reason for short-term caution.

Chart analysis by Matt Simpson - data source: TradingView NZD/USD
NZD/USD Technical Analysis: Daily Chart
The daily chart shows NZD/USD prices clinging to the 50-day EMA, with an inverted hammer candlestick forming yesterday—suggesting bearish momentum may be fading. And with the New Zealand Dollar struggling to break decisively below the 0.60 handle, a short-term bounce in NZD/USD appears plausible.
However, given the bearish signals on the weekly timeframe and the potential for the US Dollar to extend its recovery, bears may look to fade into rallies in anticipation of a move lower towards the 0.5900 support level.
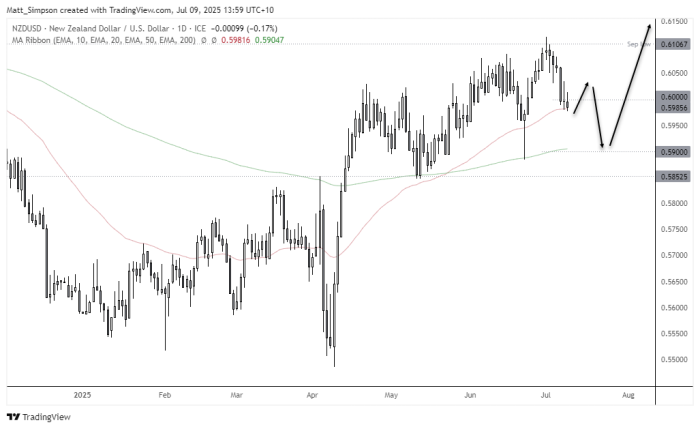
Chart analysis by Matt Simpson - data source: TradingView NZD/USD
///
AUD/NZD Technical Analysis: Australian Dollar vs New Zealand Dollar Outlook
The weekly chart of the AUD/NZD currency pair reveals a strong and impulsive move lower from the February high at 1.1174 to the April low at 1.06527. This price action appears to represent the third wave of a potential five-wave decline in the Australian Dollar vs New Zealand Dollar.
Interestingly, a 78.6% Fibonacci projection of wave three aligns closely with the key support zone formed by the 2023 and 2024 lows, around 1.0560–1.0570. This area may act as a longer-term floor for the cross, should bearish pressure resume.
In the meantime, an ABC corrective structure now seems to be unfolding, which suggests the AUD/NZD may favour bullish momentum in the near term as wave C completes. However, with the weekly RSI (2) hovering near oversold territory, traders should be alert to signs that a short-term top may be approaching.

Chart analysis by Matt Simpson - data source: TradingView AUD/NZD
AUD/NZD Daily Chart Analysis: Doji Signals Uncertainty After RBA Surprise
The AUD/NZD cross is trading within a very narrow range today, and if the Australian Dollar/New Zealand Dollar pair closes near current levels, it will likely form a spinning top doji on the daily chart—often a sign of market indecision.
Yesterday’s rally in AUD/NZD followed a surprise decision by the Reserve Bank of Australia (RBA) to hold interest rates steady. This move caught many traders off guard and triggered a short-term bounce in the Australian Dollar. The RBA's decision suggests that policymakers are awaiting the next quarterly CPI report on 30 July before taking further action, potentially opening the door to renewed speculation about future rate cuts.
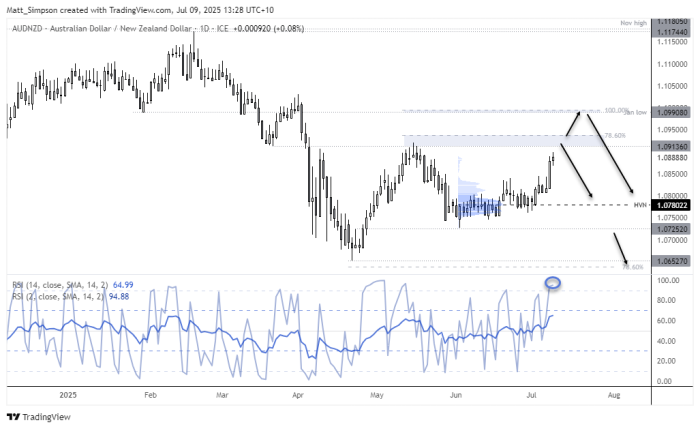
In the near term, this uncertainty could allow AUD/NZD to push higher. However, traders should watch for signs of a potential swing high forming in the 1.0913–1.0940 region. If resistance holds, this could tempt sellers to re-enter the market. A break above this area would bring the psychological 1.10 level into play, which also coincides with a 100% Fibonacci projection—making it a key resistance zone to monitor.
On the downside, the high-volume node around 1.078 and the nearby 1.0800 handle serve as initial support targets. A break below 1.0752 could accelerate bearish momentum, with the 1.0650 area becoming the next significant level of interest.
Chart analysis by Matt Simpson - data source: TradingView AUD/NZD
View the full economic calendar
View the full economic calendar
-- Written by Matt Simpson
Follow Matt on Twitter @cLeverEdge
How to trade with City Index
You can trade with City Index by following these four easy steps:
- Open an account, or log in if you’re already a customer
• Open an account in the UK
• Open an account in Australia
• Open an account in Singapore
- Search for the market you want to trade in our award-winning platform
- Choose your position and size, and your stop and limit levels
- Place the trade


The complete CFD trading experience
Award-winning platforms, competitive spreads, low commissions and dedicated support.
We live and breathe the markets and are dedicated to helping traders realise their ambitions as we continue to set the industry bar.
Economic calendar
Web Trader platform
Our sophisticated web-based platform is packed with features.
Related articles
Euro Technical Forecast: EUR/USD Snaps Five-Week Slide at Critical Support 10 17 2026
Euro is attempting to regain its footing as stretched momentum raises the stakes for the next move ahead of key PMI data and central bank decisions.

Gold weekly outlook: XAU/USD remains stuck between a rock and a hard place
Gold remains at risk of staging a deeper correction. Though the dollar has eased back a bit along with yields, both still remain fundamentally supported.


USD/JPY Weekly Outlook: Volatility Has Left the Building
The yen has ignored broad dollar weakness, falling Treasury yields and renewed market turbulence. Yet its relationship with US interest rates remains intact. So why is USD/JPY going absolutely nowhere fast?

StoneX Europe Ltd may make third party material available on this website which may contain information included but not limited to the conditions of financial markets. The material is for information purposes only and does not contain, and should not be construed as containing, investment advice and/or investment recommendation and/or an investment research and/or an offer of or solicitation for any transactions in financial instruments; any decision to enter into a specific transaction shall be made by the client following an assessment by him/her of their situation.
StoneX Europe Ltd makes no representation or warranty and assumes no liability as to the accuracy or completeness of the information provided, nor any loss arising from any investment based on a recommendation, forecast or other information supplied. You should always seek independent advice as to your suitability to speculate in any related markets and your ability to assume the associated risks, if you are at all unsure. We are not under any obligation to update any such material. Any opinion made may be personal to the author and may not reflect the opinion of StoneX Europe Ltd.