



Oil, GBP/USD Forecast: Two trades to watch
Oil falls as US-Iran diplomatic hopes rise again. GBP/USD struggles on Fed-BoE divergence.
Share this:


Oil falls as US-Iran diplomatic hopes rise again
Oil prices have fallen to their lowest level in over a week as investors grow optimistic about diplomatic progress between the U.S. and Iran at this week's UN meeting, alongside a partial recovery in shipments from Saudi Arabia.
WTI is below $95 a barrel, and Brent is below $100 a barrel, as some of the risk premium is being removed from oil prices on hopes of diplomatic de-escalation between the U.S. and Iran.
President Trump has said that he would be open to meeting the Iranian president, who is expected to be in New York this week for the UN General Assembly. Iran has meanwhile conveyed conditions for re-engaging in negotiations.
However, tensions do remain in the Middle East, as Yemen-backed Houthis have attacked sensitive sites in Saudi Arabia, as well as oil export hubs.
Still, it would appear that Saudi Arabian exports have increased to around 4 million barrels a day in September after falling to 2.4 million in August, which marked the lowest level since 2013.
Elsewhere, shipping data showed just 12 commodity vessels transiting the Strait of Hormuz on Saturday and Sunday, down from 35 the previous weekend. Separately, analysts at J.P. Morgan have said that satellite data indicated Saudi oil moving through the Strait of Hormuz averaged 2.9 million barrels a day over the past six days, up from just 700,000 in August.
The oil market is not looking for a deal to sell. It's looking for the conflict to stop escalating. China is reportedly pressing Iran to rein in the Houthis, which could help, at least in the near term.
Oil forecast – technical analysis
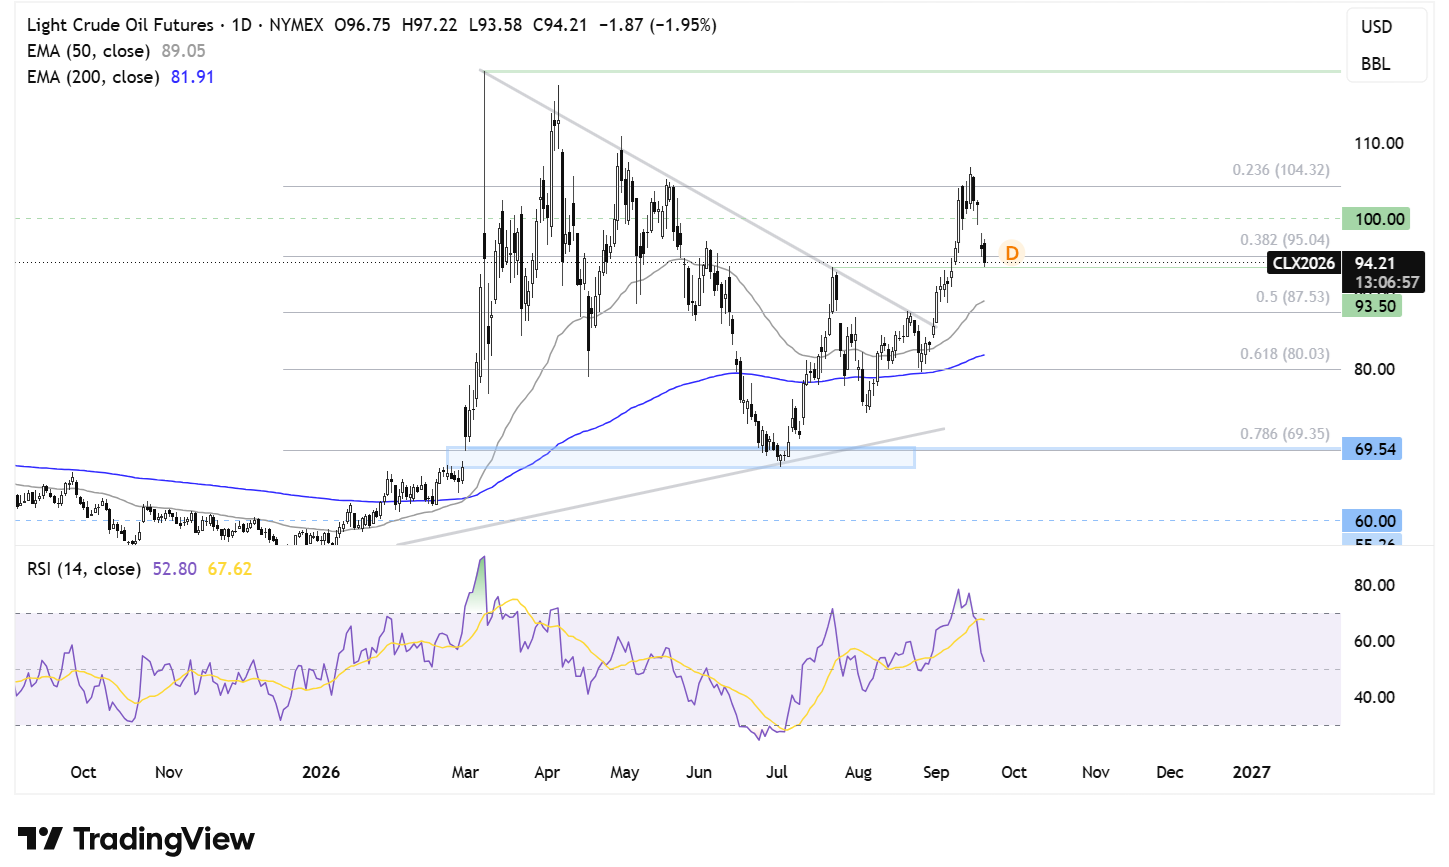
Having broken out of the symmetrical triangle pattern, oil ran into resistance above $106 before reversing lower and is now testing support at $95, the 38.2% Fibonacci retracement of the $55-$120 move.
However, the price continues to trade above its 50 and 200 day EMAs, keeping the longer-term outlook constructive, despite momentum slowing considerably.
Sellers would need to break below the $95 support zone, the 38.2% Fib level and the July high to open the door to $88, the 50% Fibonacci retracement and 50 EMA, to turn the outlook more bearish. A break below this area would expose the 200 EMA around $82.
Should the $95 support zone hold, buyers will look to reclaim $100, the psychological level, before retesting the $105 resistance zone, where the 23.6% Fibonacci retracement and September high converge. A move above $105 creates a higher high, bringing $110 into focus.
GBP/USD struggles on Fed-BoE divergence
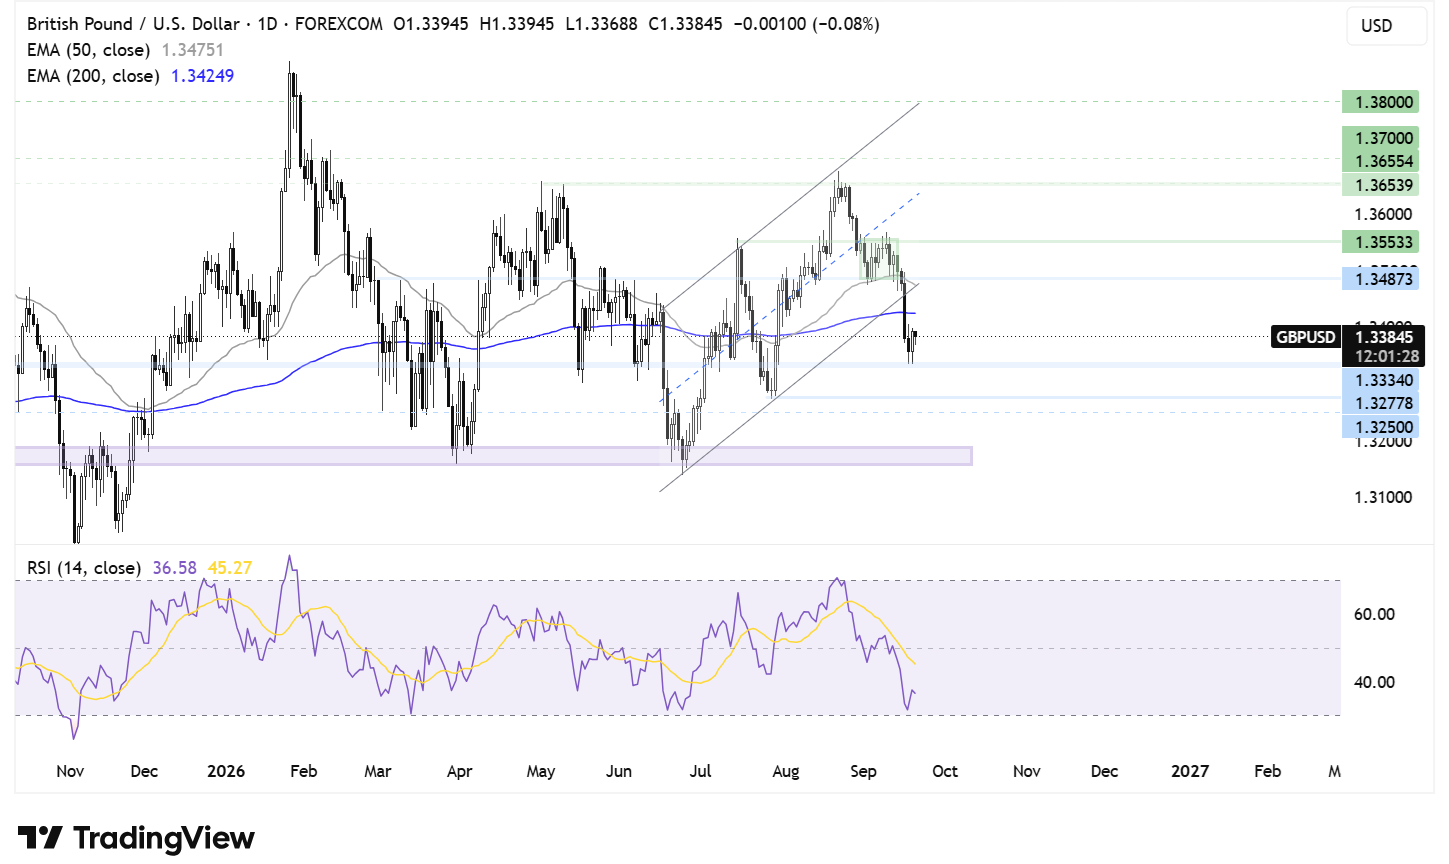
GBP/USD fell almost 1% last week. It was its fourth straight weekly decline and is holding on to those losses at the start of the new week. GBP/USD trades around 1.3380 as the U.S. dollar extends last week's gains.
The U.S. dollar jumped 1% last week after the Federal Reserve's rate hike and hawkish stance. The Fed raised rates by 25 basis points, and the dot plot revealed that Fed officials expect at least one more rate hike this year.
This was in sharp contrast to the Bank of England, which retained a cautious stance, leaving rates unchanged at 3.75% for a sixth straight meeting. The committee vote of 6-3 was also in line with expectations.
While stronger-than-expected UK retail sales on Friday helped to stem the declines, the broader BoE-Fed divergence remains unfavourable for sterling.
Meanwhile, in the Middle East, the picture remains mixed. Oil prices are falling on hopes that there may still be a diplomatic solution between the U.S. and Iran. However, oil price declines have been limited by ongoing Houthi attacks on Saudi energy infrastructure.
Still, falling oil prices could help stem safe-haven demand for the U.S. dollar and limit the downside in sterling.
Traders will be looking to speeches from key Fed officials this week, including Chicago Fed President Goolsbee and New York Fed President John Williams.
PMI data on Wednesday will also be under the spotlight, providing fresh clues about the health of the U.S. and UK economies.
GBP/USD forecast – technical analysis
GBP/USD broke down below its 50 EMA and 200 EMA and out of its ascending channel before finding support at 1.3335. The price has recovered from this low to 1.3385 at the time of writing, but the outlook remains bearish.
Sellers will look to break below 1.3335 to turn attention to 1.3250, the late-July low. A break below here creates a lower low, bringing the 1.3200 support zone into focus.
Buyers would need to rise above the 200 EMA at 1.3425 and the 50 EMA and horizontal resistance around 1.3500 to get the price on a firmer footing. A rise above 1.3500, the September high, would then see attention turn to 1.3650.
Related tags:




The complete CFD trading experience
Award-winning platforms, competitive spreads, low commissions and dedicated support.
We live and breathe the markets and are dedicated to helping traders realise their ambitions as we continue to set the industry bar.
Economic calendar
Web Trader platform
Our sophisticated web-based platform is packed with features.
Related articles

Dow Jones Forecast: DJIA rises after weaker jobs data
U.S. stocks are rising after weaker-than-expected U.S. jobs data saw markets rein in rate hike expectations.

Nasdaq 100 Forecast: NDX slips as Treasury yields keep rising
U.S. stocks are falling at the start of Q4, as gains in software stocks offset concerns over soaring Treasury yields. U.S. Treasury yields continue to rise, with the 10-year yield up 2 basis points at 5.31% and the 30-year at 5.66%, multi-decade highs.

EUR/USD, GBP/USD Outlook: RSI Hits 2020 Oversold Levels
EUR/USD, GBP/USD Outlook: The EUR/USD daily RSI has fallen to oversold levels last seen in 2020, raising the risk of a reversal across correlated currency pairs, including the US dollar and GBP/USD.

StoneX Europe Ltd may make third party material available on this website which may contain information included but not limited to the conditions of financial markets. The material is for information purposes only and does not contain, and should not be construed as containing, investment advice and/or investment recommendation and/or an investment research and/or an offer of or solicitation for any transactions in financial instruments; any decision to enter into a specific transaction shall be made by the client following an assessment by him/her of their situation.
StoneX Europe Ltd makes no representation or warranty and assumes no liability as to the accuracy or completeness of the information provided, nor any loss arising from any investment based on a recommendation, forecast or other information supplied. You should always seek independent advice as to your suitability to speculate in any related markets and your ability to assume the associated risks, if you are at all unsure. We are not under any obligation to update any such material. Any opinion made may be personal to the author and may not reflect the opinion of StoneX Europe Ltd.