



Q2 Australian CPI preview and what comes next for the ASX200
Tucked in between this week's FOMC meeting, U.S Q2 GDP data, and earnings reports from U.S mega tech is the release of Australian Q2 inflation data
Share this:

Tucked in between this week's FOMC meeting, U.S Q2 GDP data, and earnings reports from U.S mega tech is the release of Australian Q2 inflation data.
Following a 2.1% rise in Q1, headline CPI is expected to rise by 1.8% in Q2, which would take the annual rate of inflation to 6.2%, its highest level since 2001 on the back of price rises in petrol, electricity, gas, food and new home construction costs.
Core inflation or the "trimmed mean" is expected to rise by 1.5%, taking the annual rate to 4.7%.
A firmer AU Q2 CPI number on Wednesday, followed by a hawkish Fed on Thursday morning, would raise the chances that the RBA opts for a larger rate hike of 65 or 75bp when the Board meets next Tuesday.
More so, as RBA communique last week brought a new hawkish element to the table, noting that "the current level of the cash rate is well below" the estimated neutral rate, thought to be "at least" 2.5%.
Currently, the interest rate market is 77% priced for a 65bp interest rate hike at next week's RBA Board meeting, which would take the cash rate to 2%. The interest rate market then expects another 140bp of rate hikes in 2022, taking the cash rate to 3.4% by year-end.
Turning to the ASX200, last week it gained 2.81%, for its best week since March, supported by a rebound on Wall Street and gains in tech and financial stocks.
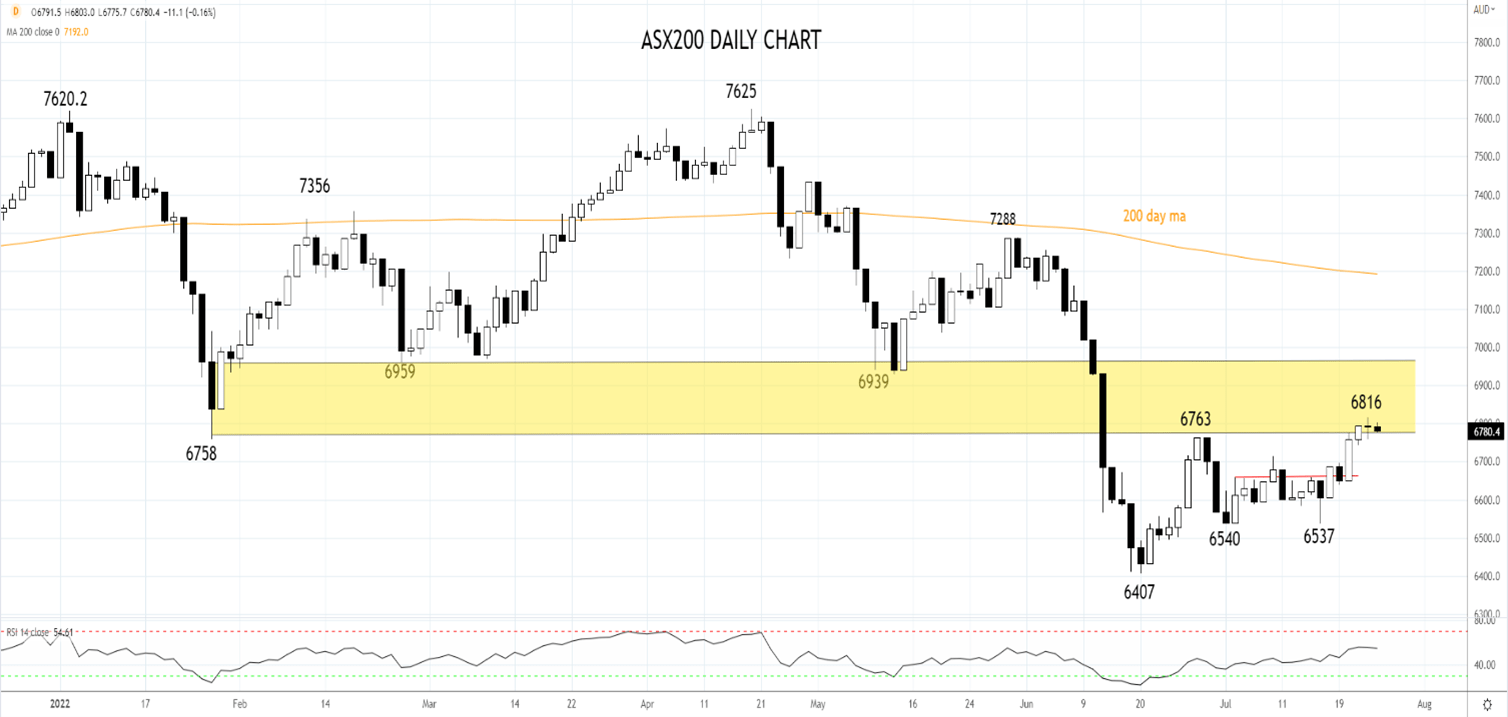
The ASX200 is chipping away at the band of resistance 6750/6950. To negate the technical damage caused by the breakdown in June, a sustained break above 6950 is required.
Until this occurs, the rally from the 6407 low is viewed as a bear market countertrend rally.
Source Tradingview. The figures stated are as of July 25th ,2022. Past performance is not a reliable indicator of future performance. This report does not contain and is not to be taken as containing any financial product advice or financial product recommendation
How to trade with City Index
You can trade with City Index by following these four easy steps:
- Open an account, or log in if you’re already a customer
• Open an account in the UK
• Open an account in Australia
• Open an account in Singapore
- Search for the company you want to trade in our award-winning platform
- Choose your position and size, and your stop and limit levels
- Place the trade
Tucked in between this week's FOMC meeting, U.S Q2 GDP data, and earnings reports from U.S mega tech is the release of Australian Q2 inflation data.
Following a 2.1% rise in Q1, headline CPI is expected to rise by 1.8% in Q2, which would take the annual rate of inflation to 6.2%, its highest level since 2001 on the back of price rises in petrol, electricity, gas, food and new home construction costs.
Core inflation or the "trimmed mean" is expected to rise by 1.5%, taking the annual rate to 4.7%.
A firmer AU Q2 CPI number on Wednesday, followed by a hawkish Fed on Thursday morning, would raise the chances that the RBA opts for a larger rate hike of 65 or 75bp when the Board meets next Tuesday.
More so, as RBA communique last week brought a new hawkish element to the table, noting that "the current level of the cash rate is well below "the estimated neutral rate, thought to be "at least" 2.5%.
Currently, the interest rate market is 77% priced for a 65bp interest rate hike at next week's RBA Board meeting, which would take the cash rate to 2%. The interest rate market then expects another 140bp of rate hikes in 2022, taking the cash rate to 3.4% by year-end.
Turning to the ASX200, last week it gained 2.81%, for its best week since March, supported by a rebound on Wall Street and gains in tech and financial stocks.
The ASX200 is chipping away at the band of resistance 6750/6950. To negate the technical damage caused by the breakdown in June, a sustained break above 6950 is required.
Until this occurs, the rally from the 6407 low is viewed as a bear market countertrend rally.
Source Tradingview. The figures stated are as of July 25th ,2022. Past performance is not a reliable indicator of future performance. This report does not contain and is not to be taken as containing any financial product advice or financial product recommendation
- Open a Forex.com account, or log in if you’re already a customer.
- Search for the pair you want to trade in our award-winning platform.
- Choose your position and size, and your stop and limit levels.
- Place the trade.
Latest market news




The complete CFD trading experience
Award-winning platforms, competitive spreads, low commissions and dedicated support.
We live and breathe the markets and are dedicated to helping traders realise their ambitions as we continue to set the industry bar.
Economic calendar
Web Trader platform
Our sophisticated web-based platform is packed with features.
Related articles

Brazil Elections: Is Investor Confidence Beginning to Fade?
One of the most relevant events for emerging markets in recent sessions has been the outcome of Brazil’s presidential election. Following Lula da Silva’s victory in the second round, investor sentiment began to deteriorate noticeably. This can be observed in both the iShares MSCI Brazil ETF and the VanEck Brazil Small-Cap ETF, two important benchmarks for tracking the Brazilian equity market, both of which have posted declines of more than 15% at the start of the week.


Silver Forecast: XAG/USD Hits Fresh 2026 Lows as Selling Pressure Accelerates
Trading conditions continue to be challenging for silver in the short term. The precious metal has been losing value at an accelerated pace and, during today's session alone, has fallen more than 5.5%, reaching new lows for 2026. This development highlights how selling pressure has become increasingly dominant across recent market activity.

USD/MXN Analysis: Mexican Peso Weakens Ahead of Key Inflation Data
The Mexican peso continues to face a difficult environment in the short term. This can be seen in the recent performance of USD/MXN, which has gained more than 1.1% over the last three trading sessions, highlighting increasingly persistent weakness in the Mexican currency.
StoneX Europe Ltd may make third party material available on this website which may contain information included but not limited to the conditions of financial markets. The material is for information purposes only and does not contain, and should not be construed as containing, investment advice and/or investment recommendation and/or an investment research and/or an offer of or solicitation for any transactions in financial instruments; any decision to enter into a specific transaction shall be made by the client following an assessment by him/her of their situation.
StoneX Europe Ltd makes no representation or warranty and assumes no liability as to the accuracy or completeness of the information provided, nor any loss arising from any investment based on a recommendation, forecast or other information supplied. You should always seek independent advice as to your suitability to speculate in any related markets and your ability to assume the associated risks, if you are at all unsure. We are not under any obligation to update any such material. Any opinion made may be personal to the author and may not reflect the opinion of StoneX Europe Ltd.