



Rising yields showing signs of cracks in housing market; USD/JPY
Rising US yields are causing homebuyers to take pause and rethink their house purchase.
Share this:

The average 30-year mortgage rate for the week ending April 22nd rose to 5.37% from 5.2% the week prior. This was the highest level since 2009! In addition, mortgage rate applications for the same week fell by 8.3% vs a fall of 5% the week prior. This was the 7th week in a row that mortgage applications fell. These housing metrics are used as leading indicators for housing activity over the next few months.
Rising interest rates have already begun to hit the housing market as Pending Home Sales for March were down 1.2% vs down 4.1% in February. This was the 5th straight monthly decline. New Home Sales in March dropped 8.6% vs a drop of 1.2% previously. This was the 3rd consecutive monthly drop. Existing Home Sales fell by 2.7% in March vs -8.6% in February.
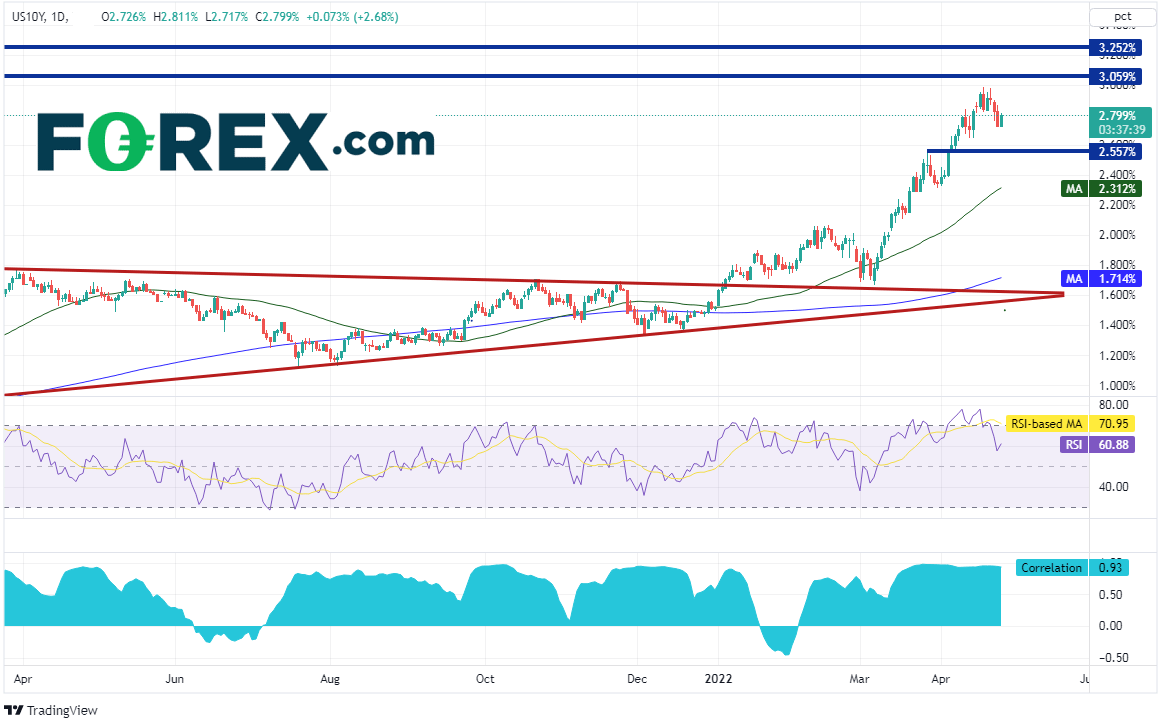
If long-term US interest rates continue to climb, then the housing market should continue to slow. This, along with inflation, reduces the purchasing power for people when buying large ticket items, such as a house. The current yield on the US 10-year Treasury is near 2.80%, just off its recent highs of 2.981% on April 20th. Notice that in just over 7 weeks, the key interest rate rose from 1.68% to 2.98%! The next resistance level is 3.059% and then the highs from November 2018 at 3.252%.

Source: Tradingview, Stone X
On a daily timeframe, there is support in 10-year yields at 2.557%, but then not until the 50 Day Moving Average at 2.312%. The bottom panel of the chart shows the correlation coefficient between 10-year yields and USD/JPY. The current reading is +0.93. Readings above +0.80 are considered to be strong correlations between 2 assets. Therefore, the correlation between USD/JPY and US 10-year yields is considered to be strong.
Source: Tradingview, Stone X
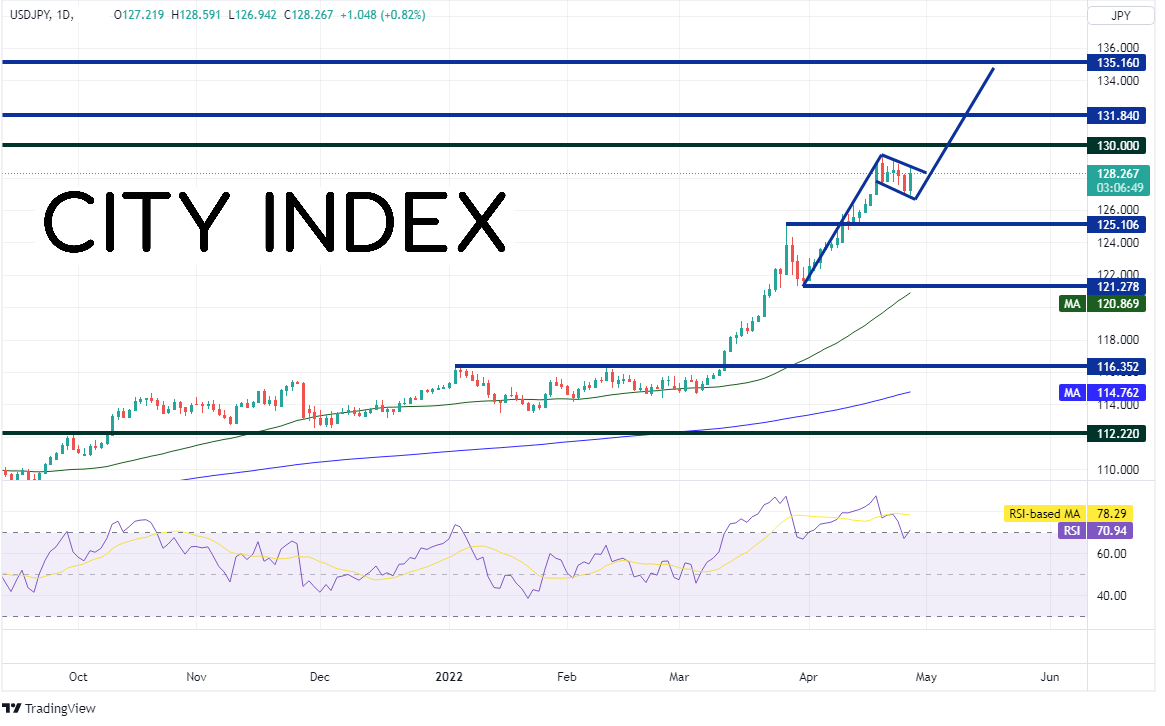
As one may have expected, USD/JPY has been racing higher with US 10-year yields. On a daily timeframe, price is currently consolidating in a flag pattern as the RSI pulls back into neutral territory. The price action for today’s candlestick is a bullish engulfing candle, in which today’s real body engulfs the real body of yesterday’s candlestick. This is considered to be bullish. If price does break higher, the target is near 134.75! However, price must first break through resistance at the psychological round number of 130, then horizontal resistance from 2002 at 131.84. If the flag pattern fails and USD/JPY moves lower, horizontal support sits at 125.10, then not again until 121.28.

Source: Tradingview, Stone X
Rising US yields are causing homebuyers to take pause and rethink their house purchase. In addition, due to the strong positive correlation between USD/JPY and 10-year yields, USD/JPY is moving higher. If yields move lower, watch to see if the housing market picks back up or if USD/JPY moves lower!
The average 30-year mortgage rate for the week ending April 22nd rose to 5.37% from 5.2% the week prior. This was the highest level since 2009! In addition, mortgage rate applications for the same week fell by 8.3% vs a fall of 5% the week prior. This was the 7th week in a row that mortgage applications fell. These housing metrics are used as leading indicators for housing activity over the next few months.
Rising interest rates have already begun to hit the housing market as Pending Home Sales for March were down 1.2% vs down 4.1% in February. This was the 5th straight monthly decline. New Home Sales in March dropped 8.6% vs a drop of 1.2% previously. This was the 3rd consecutive monthly drop. Existing Home Sales fell by 2.7% in March vs -8.6% in February.
If long-term US interest rates continue to climb, then the housing market should continue to slow. This, along with inflation, reduces the purchasing power for people when buying large ticket items, such as a house. The current yield on the US 10-year Treasury is near 2.80%, just off its recent highs of 2.981% on April 20th. Notice that in just over 7 weeks, the key interest rate rose from 1.68% to 2.98%! The next resistance level is 3.059% and then the highs from November 2018 at 3.252%.

Source: Tradingview, Stone X
On a daily timeframe, there is support in 10-year yields at 2.557%, but then not until the 50 Day Moving Average at 2.312%. The bottom panel of the chart shows the correlation coefficient between 10-year yields and USD/JPY. The current reading is +0.93. Readings above +0.80 are considered to be strong correlations between 2 assets. Therefore, the correlation between USD/JPY and US 10-year yields is considered to be strong.

Source: Tradingview, Stone X
As one may have expected, USD/JPY has been racing higher with US 10-year yields. On a daily timeframe, price is currently consolidating in a flag pattern as the RSI pulls back into neutral territory. The price action for today’s candlestick is a bullish engulfing candle, in which today’s real body engulfs the real body of yesterday’s candlestick. This is considered to be bullish. If price does break higher, the target is near 134.75! However, price must first break through resistance at the psychological round number of 130, then horizontal resistance from 2002 at 131.84. If the flag pattern fails and USD/JPY moves lower, horizontal support sits at 125.10, then not again until 121.28.
Source: Tradingview, Stone X
Trade USD/JPY now: Login or Open a new account!
• Open an account in the UK
• Open an account in Australia
• Open an account in Singapore
Rising US yields are causing homebuyers to take pause and rethink their house purchase. In addition, due to the strong positive correlation between USD/JPY and 10-year yields, USD/JPY is moving higher. If yields move lower, watch to see if the housing market picks back up or if USD/JPY moves lower!
Learn more about forex trading opportunities.
Related tags:
Latest market news




The complete CFD trading experience
Award-winning platforms, competitive spreads, low commissions and dedicated support.
We live and breathe the markets and are dedicated to helping traders realise their ambitions as we continue to set the industry bar.
Economic calendar
Web Trader platform
Our sophisticated web-based platform is packed with features.
Related articles
USD/JPY forecast: Dollar remains fundamentally supported ahead of CPI
The USD/JPY eased lower today with the greenback also declining against several other currencies. However, at the time of writing, oil prices were bouncing back and yields were off their lows again. The US dollar hadn’t moved much yet, but these forces could help it to regain its poise ahead of the release of US CPI on Wednesday.
British Pound Technical Outlook: GBP/USD Bulls Fight to Stabilize at Critical Support 10 13 2026
GBP/USD is compressing into a tight near-term range just above key support, with a breakout likely to provide the next directional cue.

EUR/USD forecast: Downside risks persist despite recovery
Amid a lack of any major news, the FX markets have been largely in consolidation mode in the first half of Tuesday’s session. The US dollar eased along with bond yields and oil prices, allowing downbeat currencies like the euro to rebound modestly. With US CPI data due for release on Wednesday, don’t expect much in the way of a sharper decline in USD ahead of it. If anything, we could see the dollar buying resume, especially if crude oil prices catch a bid again amid the ongoing situation.
StoneX Europe Ltd may make third party material available on this website which may contain information included but not limited to the conditions of financial markets. The material is for information purposes only and does not contain, and should not be construed as containing, investment advice and/or investment recommendation and/or an investment research and/or an offer of or solicitation for any transactions in financial instruments; any decision to enter into a specific transaction shall be made by the client following an assessment by him/her of their situation.
StoneX Europe Ltd makes no representation or warranty and assumes no liability as to the accuracy or completeness of the information provided, nor any loss arising from any investment based on a recommendation, forecast or other information supplied. You should always seek independent advice as to your suitability to speculate in any related markets and your ability to assume the associated risks, if you are at all unsure. We are not under any obligation to update any such material. Any opinion made may be personal to the author and may not reflect the opinion of StoneX Europe Ltd.