





S&P 500 weekly Outlook: June 1, 2025
With trade uncertainty at the forefront, the S&P 500 outlook could tilt back to bearish after what was a solid month for global stocks markets.
Share this:

In the week ahead, we will have lots of economic data from the US and a couple of rate decisions from major central banks, including the ECB and the Bank of Canada, to look forward to. However, all the focus will be on the US-China trade situation after Trump said China has totally violated the trade agreement and that he’s increasing tariffs on steel and aluminium to 50%. With trade uncertainty at the forefront, the S&P 500 outlook could tilt back to bearish after what was a solid month for global stocks markets.
Trade uncertainty back at the forefront, with debt concerns on the rise
The S&P 500 closed Friday’s session flat. But the start of June could be a skiddy one, because after the markets closed on Friday, President Donald Trump said he would be increasing tariffs on steel and aluminium to 50% from 25%, further fuelling investor anxiety. Still, the month of May marked one of the better months for global shares – certainly the best one since November 2023 – as hopes that the worst of the US tariff threat has passed saw investors pile into all sorts of risk assets. However, with renewed concerns about tariffs, and the potential for continued selling of bonds as US lawmakers start negotiating on a sweeping tax and spending bill at a time when there are serious concerns about mounting levels of government debt, the month of June could well be a volatile one as the deadline for increasing the debt ceiling gets closer. Against this backdrop, the S&P 500 outlook is far from rosy.
Technical S&P 500 outlook: Key levels to watch
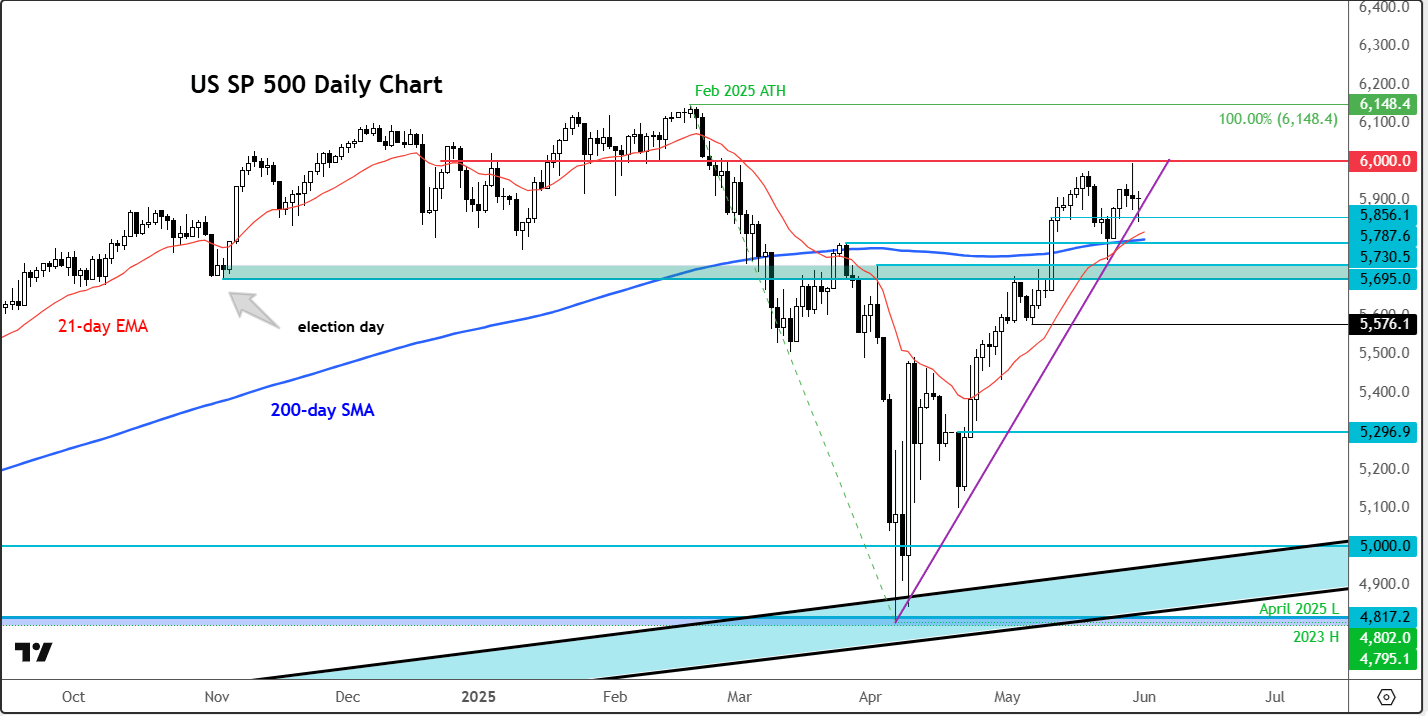
Source: TradingView.com
Friday’s doji candle on the S&P 500 chart suggests traders were unsure whether to pile in on the long side or take profit and assess the situation in the week ahead. The index has been consolidating over the last few days after running into resistance just below the 6,000 level, which is a psychologically important threshold. This area was previously a major support zone before it broke down during the big drop earlier this year. Naturally, the market is now pausing for a breather. Despite, several short-term bearish signals at the back end of last week, it's too early to say whether the trend has turned bearish again—it could simply be a pause before we see more gains. However, watch for a potential breakdown of the trendline. A closing break below it would put the technical S&P 500 outlook on a negative trajectory.
So, if the index now drops below the trendline, that could trigger some stops and lead to a potential decline. There are several support levels on the way down, including the 200-day moving average, which comes in around 5,785, also a previous high. That area will now be an important support zone to watch.
Below that, we have a shaded blue region where the market previously found support and resistance around the 5695-5730 zone. Now that we’re above it, this area could potentially turn into support again if there’s a drop.
On the upside, resistance at 6,000 is key. Above that, there’s no significant resistance until the February 2025 all-time high.
Video: S&P 500 and USD/JPY technical analysis
This video was recorded on Friday.
-- Written by Fawad Razaqzada, Market Analyst
Follow Fawad on Twitter @Trader_F_R
How to trade with City Index
You can trade with City Index by following these four easy steps:
- Open an account, or log in if you’re already a customer
• Open an account in the UK
• Open an account in Australia
• Open an account in Singapore
- Search for the company you want to trade in our award-winning platform
- Choose your position and size, and your stop and limit levels
- Place the trade
Latest market news




The complete CFD trading experience
Award-winning platforms, competitive spreads, low commissions and dedicated support.
We live and breathe the markets and are dedicated to helping traders realise their ambitions as we continue to set the industry bar.
Economic calendar
Web Trader platform
Our sophisticated web-based platform is packed with features.
Related articles

The RBA Hiked Rates and the Australian Dollar Still Fell
AUD/USD fell after the RBA rate hike because the central bank's hawkish stance was already priced in while the U.S. dollar stayed firm.

EUR/USD forecast: Eurozone stagflation risks mount as dollar holds firm ahead of data
The dollar was bouncing back at the time of writing, after it had eased overnight on the back of some weaker-than-expected economic data yesterday which had prompted markets to scale back expectations of an October Fed rate hike. However, with more significant US data due today and Friday, and with oil prices continuing to remain elevated, the dollar’s broader direction remains bullish.

AUD/USD outlook: Aussie slips despite hawkish RBA ahead of key data
The AUD/USD was unable to benefit from the Reserve Bank of Australia’s 25-basis-point rate hike overnight. The RBA lifted the cash rate to 4.60%, in line with expectations. However, the Australian dollar weakened following the decision, with much of the Bank’s hawkish stance seemingly priced in ahead of the announcement. The US dollar has also remained largely supported following the recent turmoil in the bond markets.
StoneX Europe Ltd may make third party material available on this website which may contain information included but not limited to the conditions of financial markets. The material is for information purposes only and does not contain, and should not be construed as containing, investment advice and/or investment recommendation and/or an investment research and/or an offer of or solicitation for any transactions in financial instruments; any decision to enter into a specific transaction shall be made by the client following an assessment by him/her of their situation.
StoneX Europe Ltd makes no representation or warranty and assumes no liability as to the accuracy or completeness of the information provided, nor any loss arising from any investment based on a recommendation, forecast or other information supplied. You should always seek independent advice as to your suitability to speculate in any related markets and your ability to assume the associated risks, if you are at all unsure. We are not under any obligation to update any such material. Any opinion made may be personal to the author and may not reflect the opinion of StoneX Europe Ltd.