



S&P 500 forecast: Democrats’ midterm victory rattled markets before dip buyers stepped in
Markets had a wild overnight session, with futures initially plunging before staging a sharp reversal and turning decisively higher. Global equity markets also bounced back, alongside gold and silver, while the US dollar has weakened. Oil prices fell on hopes of a deal between the US and Iran, providing another boost to market sentiment. The key question is why have markets rebounded so strongly and, more importantly, whether the recovery can last, given the prior assumption that a blue sweep would have been net negative for stocks?
Share this:

Markets had a wild overnight session, with futures initially plunging before staging a sharp reversal and turning decisively higher. Global equity markets also bounced back, alongside gold and silver, while the US dollar has weakened. Oil prices fell on hopes of a deal between the US and Iran, providing another boost to market sentiment. The key question is why have markets rebounded so strongly and, more importantly, whether the recovery can last, given the prior assumption that a blue sweep would have been net negative for stocks? We maintain a cautious S&P 500 forecast and wouldn’t want to chase it higher after such a powerful move.
So why did the markets rebound?
One reason behind the rebound is that the election outcome removes some of the political uncertainty hanging over markets for the next couple of years. With Trump’s hands now tied, the prospect of more erratic policy announcements should diminish, potentially providing a more stable backdrop for investors. Another reason is that the blue sweep was partially priced in already, so markets were not entirely surprised by the outcome. Sell the rumour, buy the news comes into mind.
Declining Treasury yields suggests investors also think that a split government would limit massive fiscal expansion and curb the federal deficit.
There are also hopes of a potential peace deal between the US and Iran. However, that alone does not explain the sudden strength of the overnight rally.
This could turn out to be a typical bear market rally, characterised by sharp moves higher that eventually lose momentum as the session progresses or over the next few days.
That is how I would approach the current price action. I would be reluctant to chase the market higher, particularly given how volatile trading has been lately.
It is therefore worth waiting to see how the next couple of sessions unfold before forming a stronger directional view. For now, the risks remain tilted to the downside once the dust settles.
Blue Sweep: What does the Democrats victory mean for markets?
The Democrats’ sweeping victory in the US midterm elections, securing control of both the Senate and the House, marks a significant setback for Donald Trump, leaving him facing a divided government for the remainder of his presidency. Trump has acknowledged that the war in Iran played a part in the defeat, although the bigger issue is arguably domestic: voters remain deeply frustrated by the cost of living and have held the president responsible. The scale of the backlash was particularly striking in the Senate, where Democrats scored victories in traditional Republican strongholds, including Texas, Ohio and Kansas.
Markets initially reacted sharply, with US equity futures and technology-heavy indices coming under heavy selling pressure. However, the subsequent rebound has been just as notable, suggesting that investors were quick to buy the dip rather than reassess their broader exposure to equities.
The initial weakness reflected concerns about what a Democrat-controlled Congress might mean for the technology sector, particularly the enormous investment cycle underpinning the AI trade. With Amazon, Alphabet and Meta collectively committing hundreds of billions of dollars to AI infrastructure, any prospect of increased regulatory scrutiny or obstacles to data-centre development was always going to attract attention. There is also the question of whether Democrats could seek to rein in some of the industry’s more ambitious expansion plans.
However, the recovery from the lows suggests that much of this political risk may already have been priced in. There is also a growing sense of relief that Trump’s ability to push through disruptive policy initiatives will be significantly constrained. That could have implications beyond technology. A weaker political position may increase pressure on the administration to bring the Iran conflict to an end, potentially paving the way for a substantial decline in oil prices and easing some of the inflationary pressure facing the US economy.
Once the dust settles, a Democrat-controlled Congress may turn out to be mildly negative for risk, partly because of the potential implications for the AI investment story and partly because of the risk of another prolonged government funding standoff, potentially from next summer.
S&P 500 forecast and key levels to watch
Part of the recovery could simply be technical, with buyers stepping in around key support at 7,500 on S&P 500 futures.
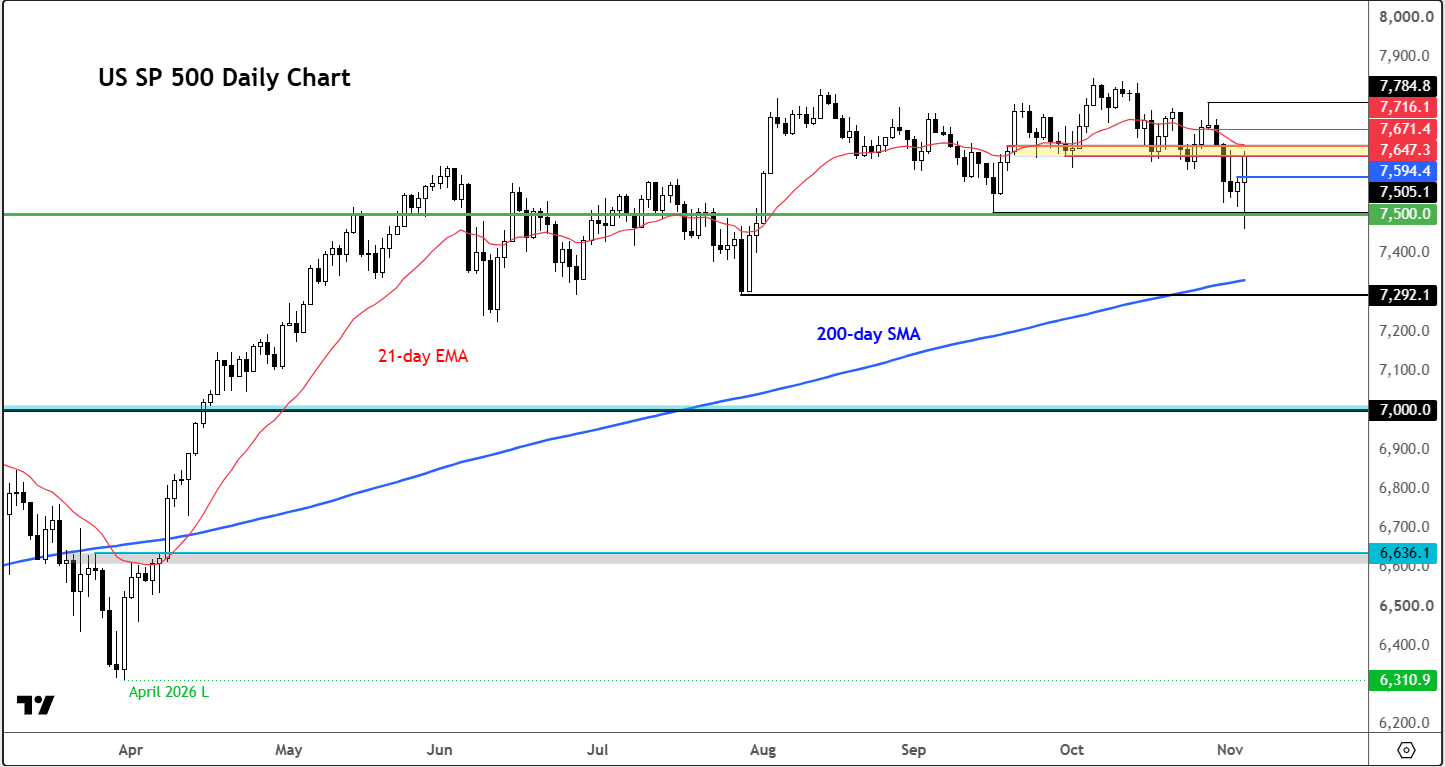
On our US SP 500 chart, derived from the S&P 500 futures, the 7,647–7,671 area marks an important resistance zone, having previously provided considerable support before last Friday’s breakdown.
That area was tested on Monday and is now being challenged again. The question is whether sellers will step back in at these levels or whether buyers can push the index through.
A decisive break above this zone would bring 7,716 into focus. This marks Wednesday’s low, when the index formed an inverted hammer candle, and could now act as resistance if the market manages to recover that far.
On the downside, Tuesday’s high at 7,594 is the first level of support. That needs to hold to prevent another leg lower.
Below there, support becomes relatively thin until the 7,500 area, which was tested overnight and prompted a decent recovery.
A break below 7,500 would make the technical outlook more bearish again, potentially opening the door to a retest of 7,400.
Further down, the 200-day moving average comes in at 7,332, while the July low stands at 7,292. The latter could become the next downside target if selling pressure accelerates.



The complete CFD trading experience
Award-winning platforms, competitive spreads, low commissions and dedicated support.
We live and breathe the markets and are dedicated to helping traders realise their ambitions as we continue to set the industry bar.
Economic calendar
Web Trader platform
Our sophisticated web-based platform is packed with features.
Related articles

S&P 500 forecast: Democrats’ midterm victory rattled markets before dip buyers stepped in
Markets had a wild overnight session, with futures initially plunging before staging a sharp reversal and turning decisively higher. Global equity markets also bounced back, alongside gold and silver, while the US dollar has weakened. Oil prices fell on hopes of a deal between the US and Iran, providing another boost to market sentiment. The key question is why have markets rebounded so strongly and, more importantly, whether the recovery can last, given the prior assumption that a blue sweep would have been net negative for stocks?

Silver, Nasdaq Outlook: Democratic Win Supports Risk-Asset Rebounds
A Democratic win in the U.S. midterm elections is supporting rebounds in risk assets, including precious metals, currency pairs, cryptocurrencies and U.S. indices. This reaction appears to align with changing sentiment around the war and its inflationary impact.

Blue wave adds to Nikkei’s AI troubles
The Nikkei 225 has taken another beating as a Democratic sweep adds to concerns about AI investment returns. But after the scale of the earlier declines, how much bad news is already priced in?

StoneX Europe Ltd may make third party material available on this website which may contain information included but not limited to the conditions of financial markets. The material is for information purposes only and does not contain, and should not be construed as containing, investment advice and/or investment recommendation and/or an investment research and/or an offer of or solicitation for any transactions in financial instruments; any decision to enter into a specific transaction shall be made by the client following an assessment by him/her of their situation.
StoneX Europe Ltd makes no representation or warranty and assumes no liability as to the accuracy or completeness of the information provided, nor any loss arising from any investment based on a recommendation, forecast or other information supplied. You should always seek independent advice as to your suitability to speculate in any related markets and your ability to assume the associated risks, if you are at all unsure. We are not under any obligation to update any such material. Any opinion made may be personal to the author and may not reflect the opinion of StoneX Europe Ltd.