


S&P 500, Nasdaq 100 Claw Back But NVDA Cloud Looms Overhead
Last week was green for both the Nasdaq and S&P 500 but given the sell-off that led into that bounce there’s still a very real question as to whether bears still have a statement to make. And the NVDA situation presents a very real threat.
Share this:

S&P 500, Nasdaq 100 Talking Points:
- Stocks rallied last week on the back of oversold bounces in both the Nasdaq and NVDA.
- The bigger question now is whether the rally can continue into something more than an oversold bounce, and NVDA earnings will likely play a key role in the matter as the AI leader will be looked to for wider indication of health in the space.
Nasdaq 100 futures found support at a major spot the prior Friday, and that bounce largely continued through last week even with a darkening storm cloud over one of the darlings of the market. It was last weekend when the email from NVDA’s former CEO Jensen Huang found its way on social media, where he confessed to being unfaithful to his wife. And while this may seem like just another salacious story for the tabloids it was the connotations around that that rattled markets, as accusations of his relationship with a Chinese spy raised questions as to whether Huang had circumvented export controls on vital technology crucial to AI development.
Since that weekend email, it’s come out that Huang had relationships with at least two other women, both of which were employees at NVDA. And given how widespread the accusations have become it also calls into question how truthful Huang may have been in other areas of his life, as much of the AI space is resting on the expectations of continued growth as brought upon by deals driven by Huang.
NVDA Presents Massive Risk to the AI Trade
This content was created by an affiliate of FOREX.com and represents the views and opinions of the author/speakers, not the views and opinions of FOREX.com, StoneX Group Inc., or its subsidiaries. The content has not been independently reviewed by FOREX.com.
Nasdaq Bounce from Oversold
With the sell-off in the Nasdaq the index did something it hadn’t done since April of 2025, and that’s gone into oversold territory on the daily chart. And in that prior instance, the index rallied massively after that RSI crossover, and last week we saw the same. Also of interest is the fact that NVDA had similarly pushed into oversold territory for the first time since April of 2025.
Nasdaq 100 Daily Chart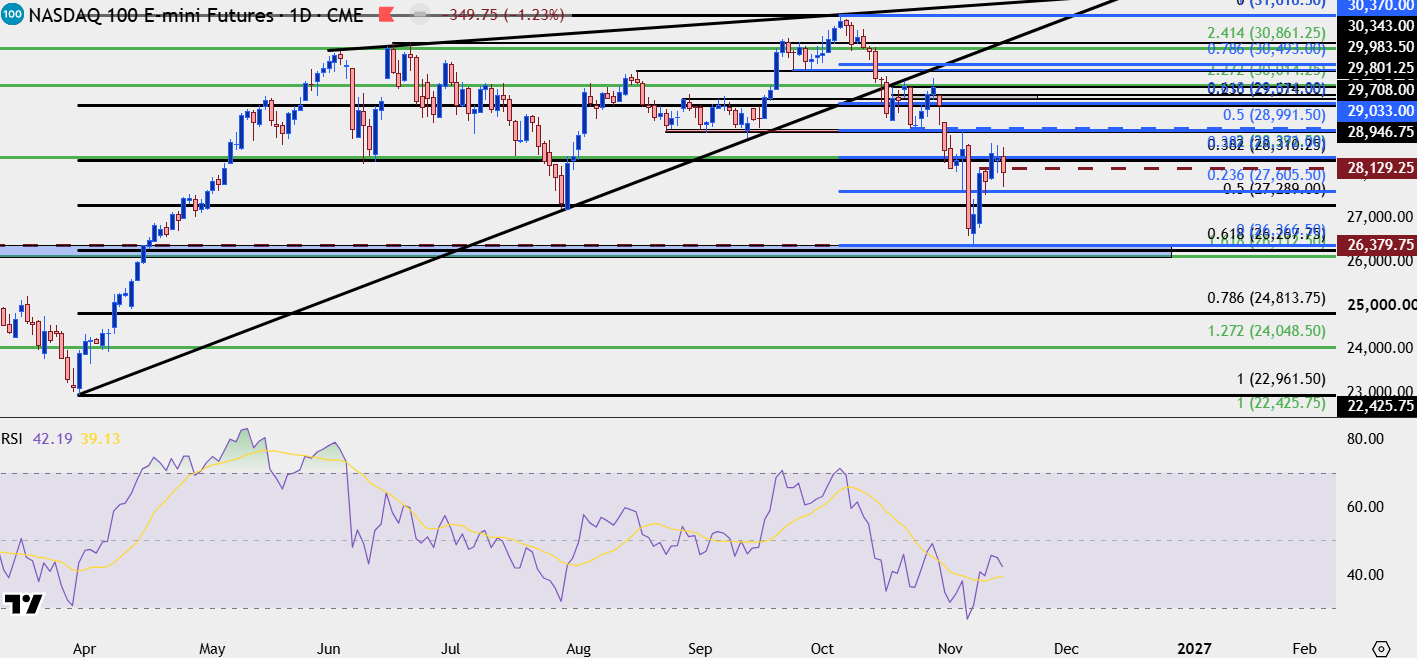
Chart prepared by James Stanley; data derived from Tradingview
Nasdaq 100 Shorter-Term
From short-term charts there’s an early build of bullish price action and there’s a couple of key zones that bulls must defend to keep that in order. There’s a Fibonacci level at 27,605 and another at 27,289 which, ideally, would contain higher-lows for bullish resumption scenarios. But big picture, it’s the same 26,366 level, which had set resistance twice back in October of 2025 and January of 2026 that looms large, and if that level is traded through, the next big spot down is all the way around the 25k level.
Nasdaq 100 Four-Hour Chart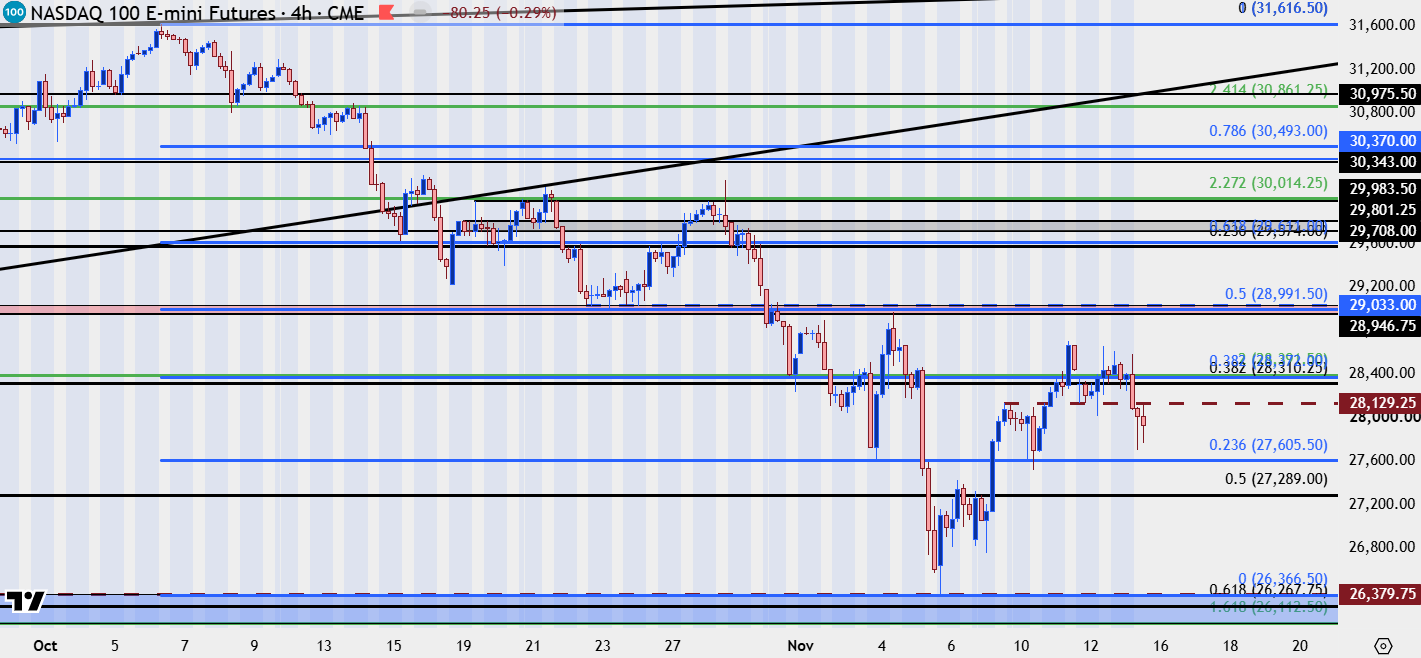
Chart prepared by James Stanley; data derived from Tradingview
NVDA into Earnings
Setting up into NVDA earnings next week, the stock is still in oversold territory on the daily chart even despite a strong bounce on Thursday following a major gap-down. That bounce hit from the 150 level and as I noted in the video above, there’s some questions to be answered regarding revenue expectations around the company. Many of the deals pushed by Huang involve companies that are both buying NVDA products and are also receiving some type of benefit from the company, either through investment or backing. That circuitous relationship has worked well for both parties on the way up, but as rates have risen and accessing cheap capital has become more complicated, it’s brought question to the sustainability of such a system.
While Huang commanded a significant amount of trust in the past in building those relationships and driving that growth, given the loss of confidence and trust there’s now a major question behind whether that revenue growth will remain in place. This remains a market to watch next week particularly as we go into NVDA earnings.
NVDA Daily Price Chart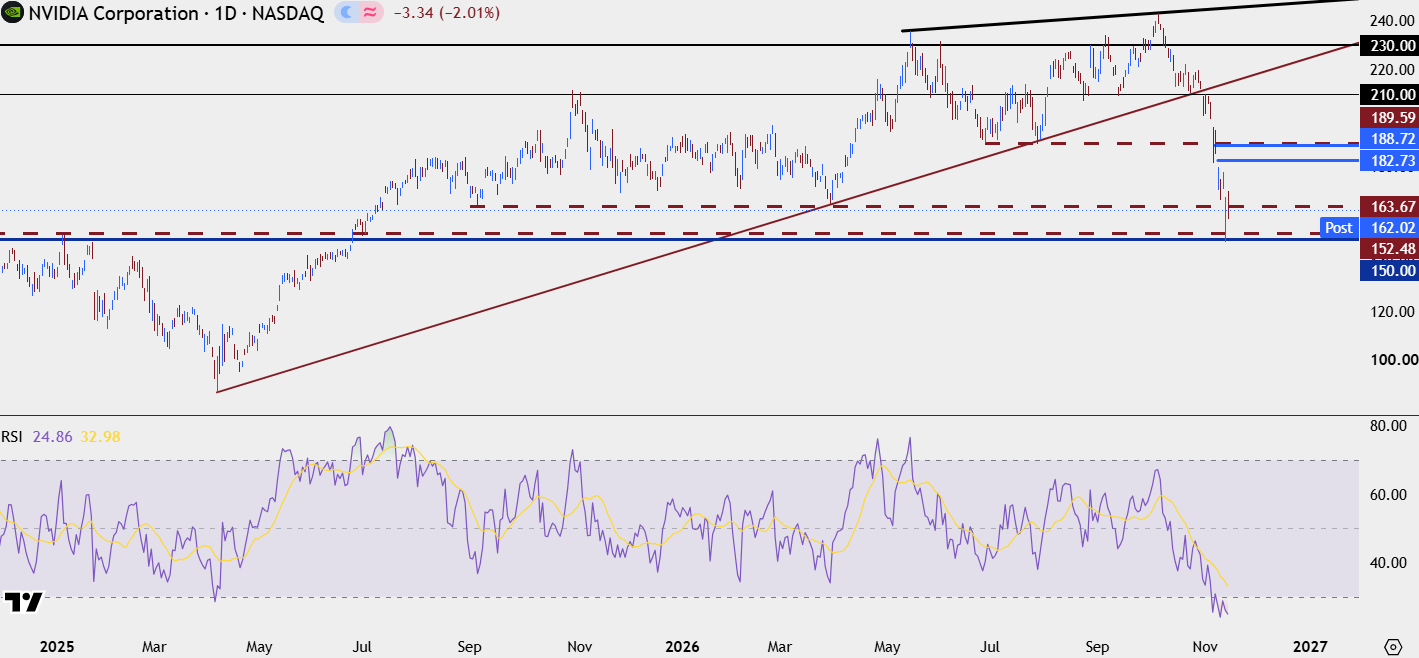
Chart prepared by James Stanley; data derived from Tradingview
S&P 500
NVDA is also a large part of the S&P 500 so when the stock began taking hits so too did the indices. The prior Friday saw the S&P hold support at a massive level – the same that held the lows in July just after Kevin Warsh’s second rate decision atop the Fed. That plots at 7324 and that bounce extended through the past week. While 7675 held resistance, there does remain a shorter-term sequencing of higher-highs and lows that’s relevant for next week, and I’ll look into that next.
S&P 500 Daily Chart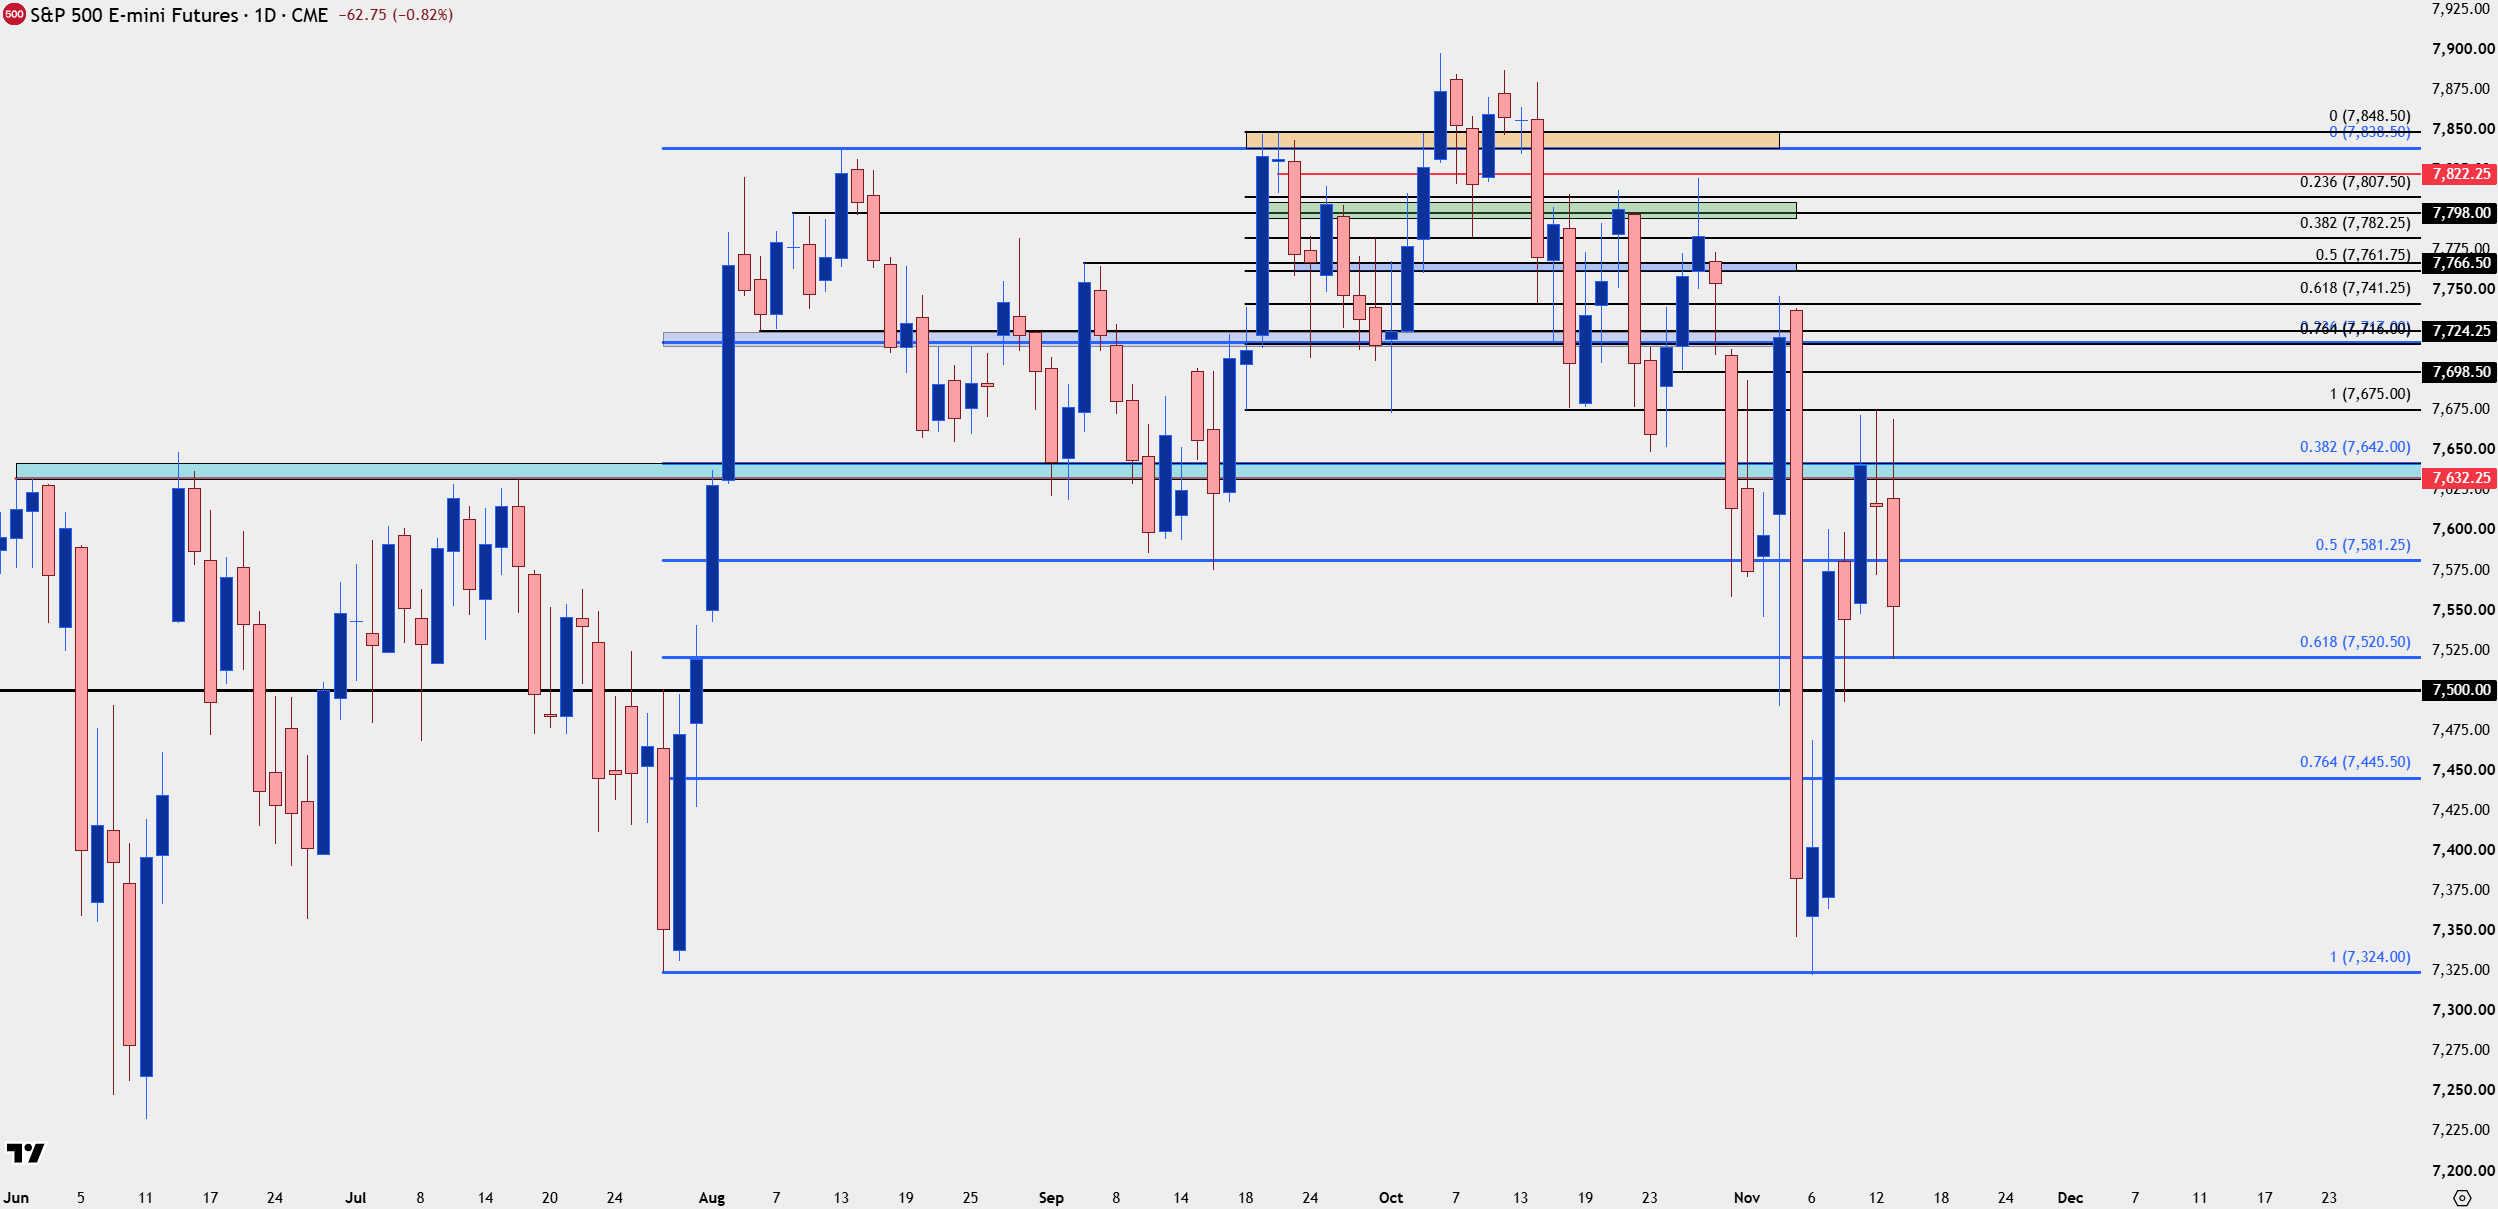
Chart prepared by James Stanley; data derived from Tradingview
S&P 500 Shorter-Term
In the S&P 500 there’s several familiar levels and zones that remain in-place. The 7632-7642 zone helped to hold resistance last week, and that’s the same that the highs back in June and July before coming in as shorter-term resistance following the breakout. The 7500 level and 7520 Fibonacci level held support last week with higher-lows, and that sets the stage for next week.
As I had looked at in the prior Top 5 Charts Video, the S&P 500 appears more attractively situated for bullish scenarios while the Nasdaq still shows a greater degree of vulnerability, particularly given the fact that rates have just pushed back above 5% on the 10-year note.
S&P 500 Daily Chart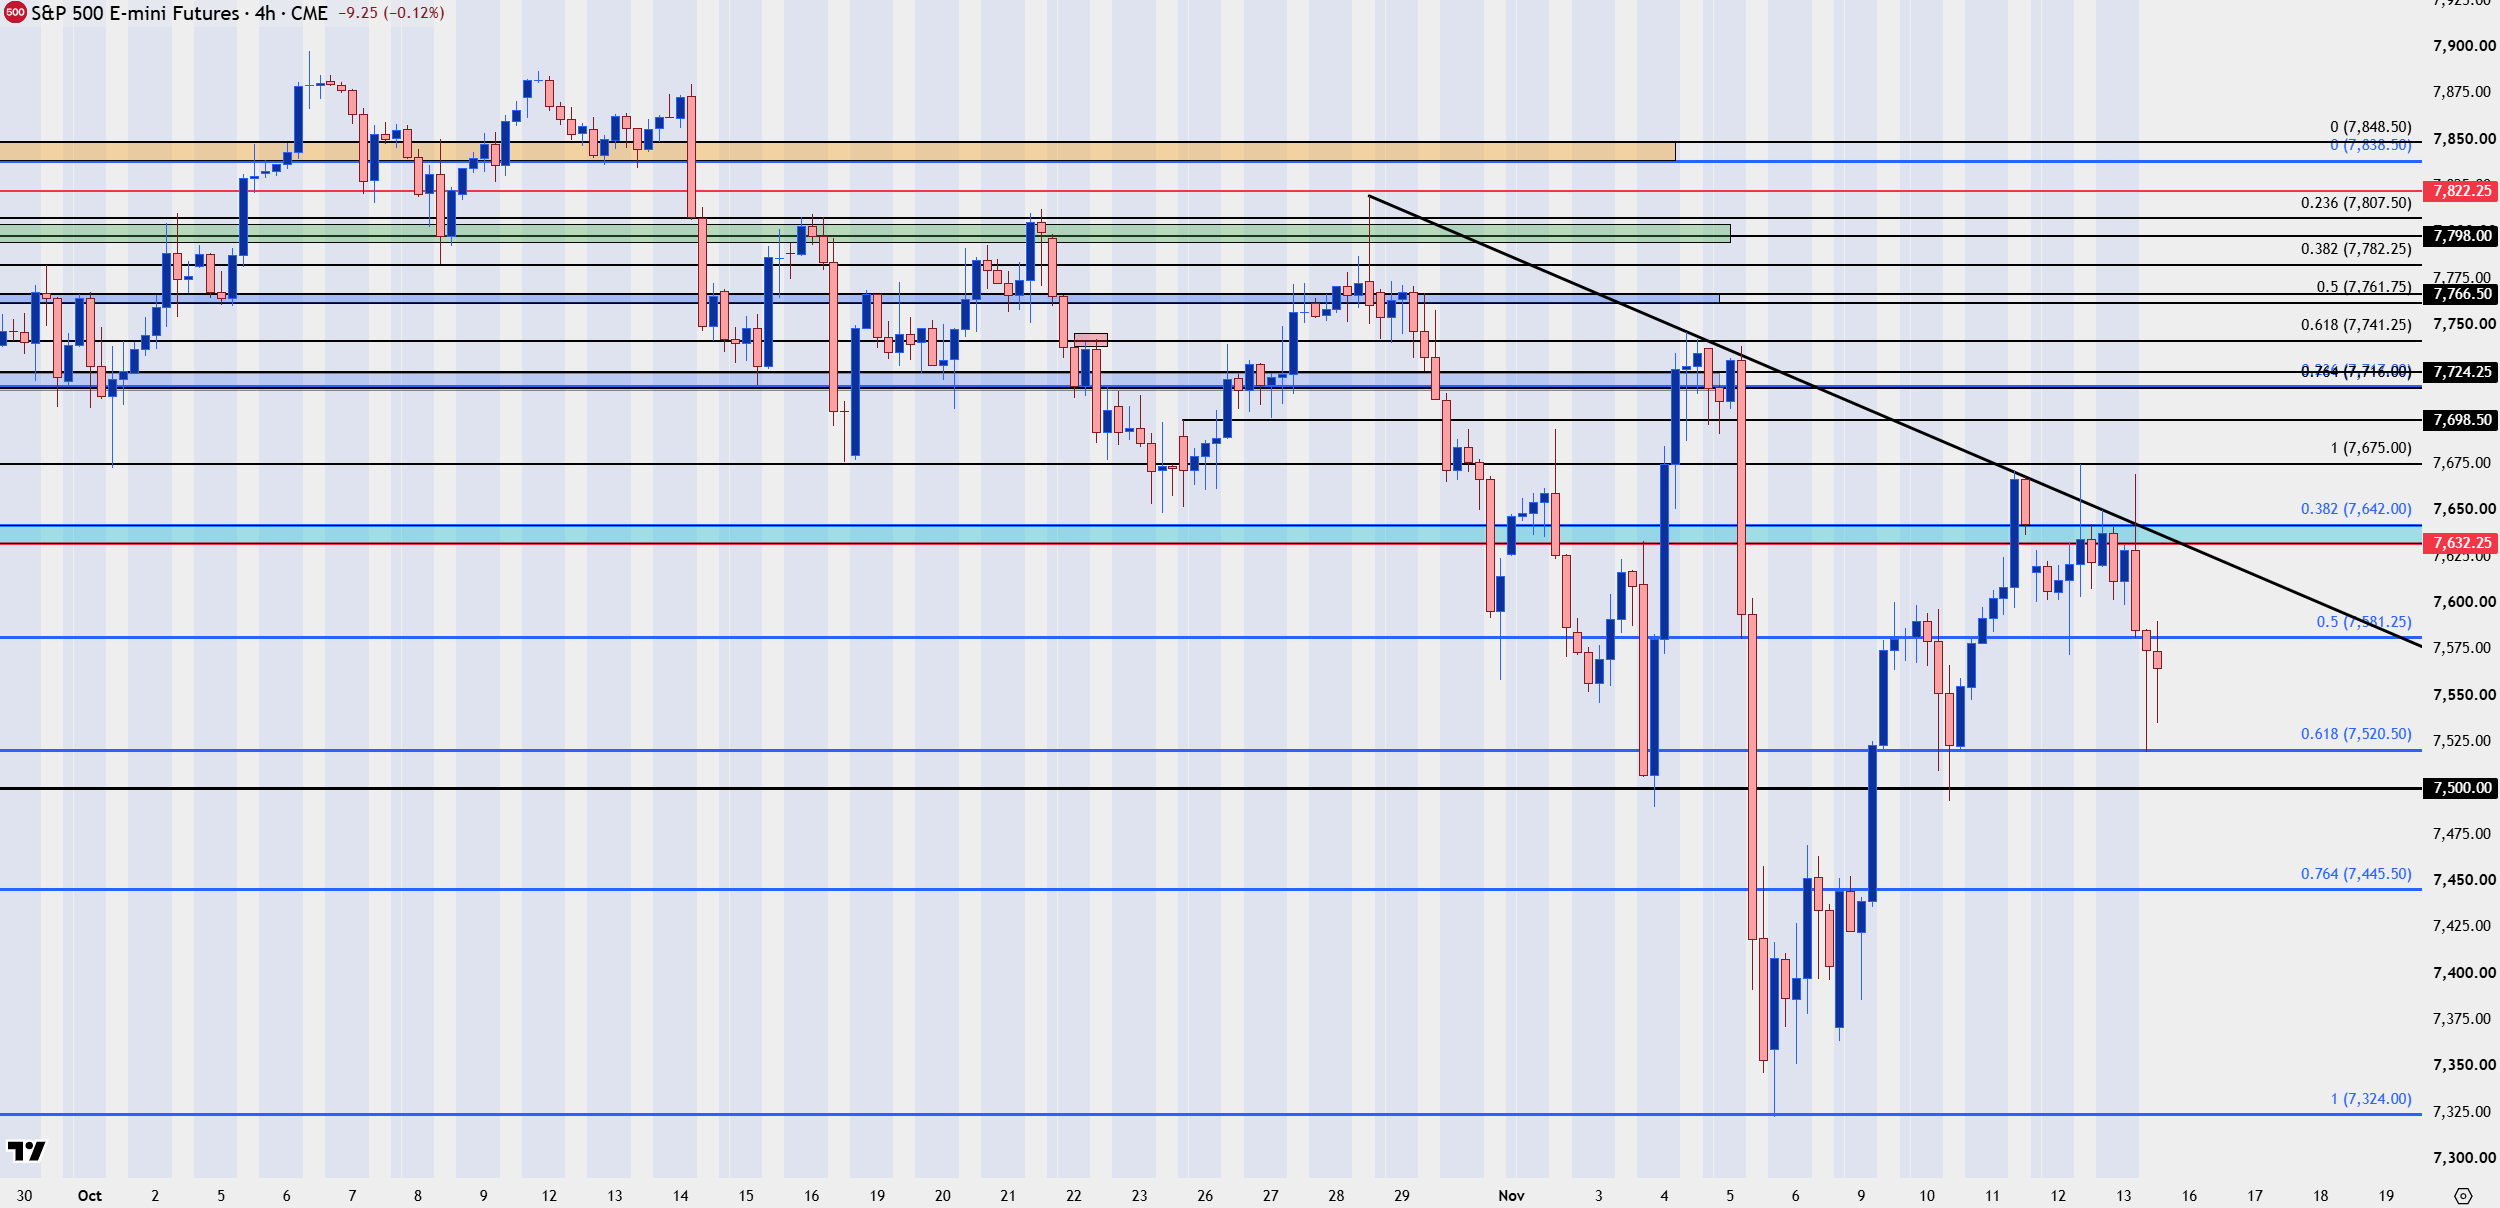
Chart prepared by James Stanley; data derived from Tradingview
--- written by James Stanley, Senior Market Analyst, Global Macro
Latest market news




The complete CFD trading experience
Award-winning platforms, competitive spreads, low commissions and dedicated support.
We live and breathe the markets and are dedicated to helping traders realise their ambitions as we continue to set the industry bar.
Economic calendar
Web Trader platform
Our sophisticated web-based platform is packed with features.
Related articles
S&P, Nasdaq Slide as NVDA, AI Worries Continue to Build
It was a busy weekend in the headlines as a campaign to bring back Jensen Huang atop NVDA gained steam, even with accusations of possible treason and a circular funding model that has started to raise questions.
Nasdaq 100 Forecast: NDX falls ahead of Nvidia’s earnings & Anthropic’s debut this week
U.S. stocks are heading for a weaker open amid a challenging macro backdrop and with AI-linked stocks once again under pressure ahead of Nvidia's results later this week. Attention is also turning to Anthropic's highly anticipated IPO.


Crude Oil Weekly Outlook: Geopolitics vs Oversupply Risks
Crude Oil Weekly Outlook: The IEA has flagged the risk of an oil supply surplus since the Iran war began. Yet WTI and Brent have held onto bullish rebounds from key support near 84 and 89, respectively, as geopolitical risks persist.

StoneX Europe Ltd may make third party material available on this website which may contain information included but not limited to the conditions of financial markets. The material is for information purposes only and does not contain, and should not be construed as containing, investment advice and/or investment recommendation and/or an investment research and/or an offer of or solicitation for any transactions in financial instruments; any decision to enter into a specific transaction shall be made by the client following an assessment by him/her of their situation.
StoneX Europe Ltd makes no representation or warranty and assumes no liability as to the accuracy or completeness of the information provided, nor any loss arising from any investment based on a recommendation, forecast or other information supplied. You should always seek independent advice as to your suitability to speculate in any related markets and your ability to assume the associated risks, if you are at all unsure. We are not under any obligation to update any such material. Any opinion made may be personal to the author and may not reflect the opinion of StoneX Europe Ltd.