





Should Traders Buy the Dip That Depends on Policymakers
A strong response from global policymakers may be the sign traders need to see for equity markets to form a bottom...
Share this:

US Dollar Outlook: USD/JPY
USD/JPY appears to be stuck in a defined range even as US JOLTS Job Openings climbs to 8.04M in August from 7.71M the month prior, but the ongoing shift in the carry trade may continue to influence the exchange rate as the Federal Reserve plans to further unwind its restrictive policy.
USD/JPY Outlook Mired by Negative Slope in 50-Day SMA
USD/JPY holds below the 50-Day SMA (145.69) following the failed attempt to test the September high (147.21), and it remains to be seen if the exchange rate will track the negative slope in the moving average as Fed Chairman Jerome Powell acknowledges that ‘if the economy evolves broadly as expected, policy will move over time toward a more neutral stance.’
Join David Song for the Weekly Fundamental Market Outlook webinar. David provides a market overview and takes questions in real-time. Register Here
Nevertheless, Chairman Powell insists that ‘we are not on any preset course’ while speaking at the National Association for Business Economics, with the official going onto say that ‘this is not a committee that feels like it’s in a hurry to cut rates quickly.’
With that said, USD/JPY may face range bound conditions as recent remarks from Chairman Powell curb speculation for another 50bp rate cut, but swings in the carry trade may continue to impact the exchange rate as major central banks implement lower interest rates.
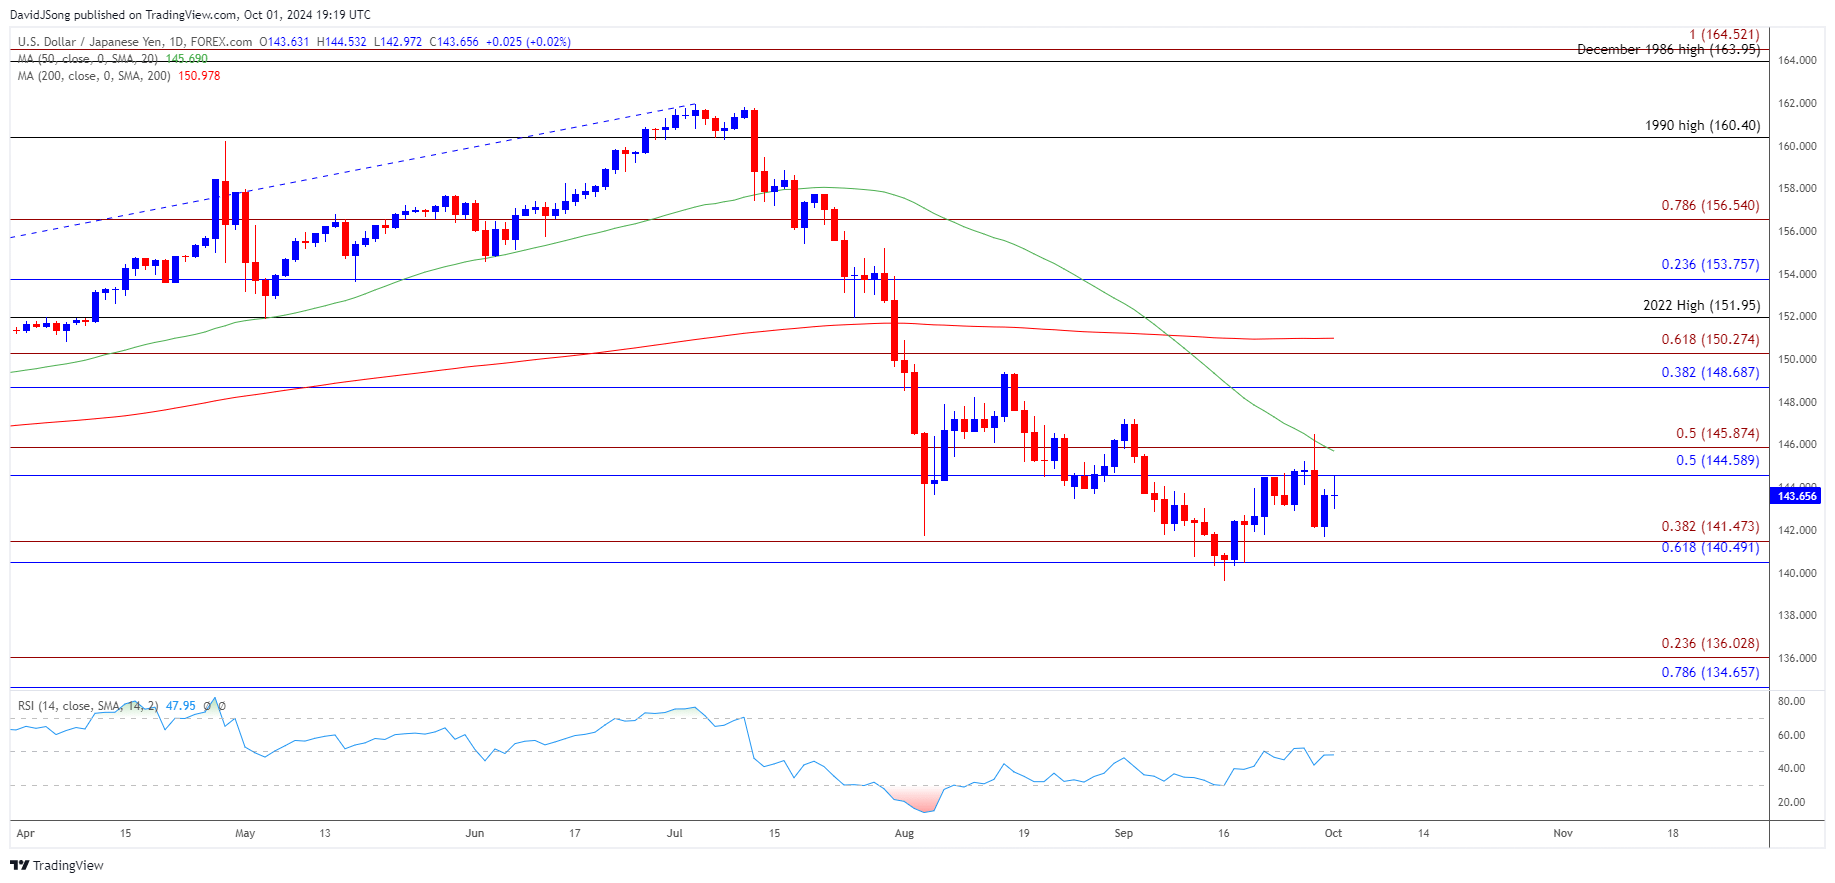
USD/JPY Price Chart – Daily
Chart Prepared by David Song, Strategist; USD/JPY on TradingView
- Keep in mind, the recent recovery in USD/JPY emerged following the failed attempts to close below the 140.50 (61.8% Fibonacci retracement) to 141.50 (38.2% Fibonacci extension) zone, and the exchange rate may further retrace the decline from the September high (147.21) as it extends the advance from the start of the week.
- However, lack of momentum to close above the 144.60 (50% Fibonacci retracement) to 145.90 (50% Fibonacci extension) region may keep USD/JPY within the September range, and the exchange rate may track sideways if it largely ignores the negative slope in the 50-Day SMA (145.69).
- Meanwhile, a close below the 140.50 (61.8% Fibonacci retracement) to 141.50 (38.2% Fibonacci extension) zone may push USD/JPY towards the July 2023 low (137.24), with the next region of interest coming in around 134.70 (78.6% Fibonacci retracement) to 136.00 (23.6% Fibonacci extension).
--- Written by David Song, Senior Strategist
Follow on Twitter at @DavidJSong
Latest market news




The complete CFD trading experience
Award-winning platforms, competitive spreads, low commissions and dedicated support.
We live and breathe the markets and are dedicated to helping traders realise their ambitions as we continue to set the industry bar.
Economic calendar
Web Trader platform
Our sophisticated web-based platform is packed with features.
Related articles
US Midterm Fallout: What Does the “Blue Tsunami” Mean for the S&P 500?
Democrats made sweeping gains in the US midterm elections, winning control of both the House and Senate - what does it mean for the S&P 500 and the AI trade?

S&P 500 forecast: Democrats’ midterm victory rattled markets before dip buyers stepped in
Markets had a wild overnight session, with futures initially plunging before staging a sharp reversal and turning decisively higher. Global equity markets also bounced back, alongside gold and silver, while the US dollar has weakened. Oil prices fell on hopes of a deal between the US and Iran, providing another boost to market sentiment. The key question is why have markets rebounded so strongly and, more importantly, whether the recovery can last, given the prior assumption that a blue sweep would have been net negative for stocks?


Silver, Nasdaq Outlook: Democratic Win Supports Risk-Asset Rebounds
A Democratic win in the U.S. midterm elections is supporting rebounds in risk assets, including precious metals, currency pairs, cryptocurrencies and U.S. indices. This reaction appears to align with changing sentiment around the war and its inflationary impact.

StoneX Europe Ltd may make third party material available on this website which may contain information included but not limited to the conditions of financial markets. The material is for information purposes only and does not contain, and should not be construed as containing, investment advice and/or investment recommendation and/or an investment research and/or an offer of or solicitation for any transactions in financial instruments; any decision to enter into a specific transaction shall be made by the client following an assessment by him/her of their situation.
StoneX Europe Ltd makes no representation or warranty and assumes no liability as to the accuracy or completeness of the information provided, nor any loss arising from any investment based on a recommendation, forecast or other information supplied. You should always seek independent advice as to your suitability to speculate in any related markets and your ability to assume the associated risks, if you are at all unsure. We are not under any obligation to update any such material. Any opinion made may be personal to the author and may not reflect the opinion of StoneX Europe Ltd.