



SPX outlook: Fed Decision June 2025: What is expected?
The Fed is set to keep rates steady at 4.5% today, so traders are now focused on what Powell will hint. With inflation cooling and growth slowing, odds of a September rate cut are rising. So now the question remains if the Fed will signal a dovish pivot, or hold firm amid geopolitical tensions and tariff pressures? Equity markets are cautious yet below record highs and bond yields are rising.
Share this:

What is expected from the FED interest rate decision today?
At the heart of today's June 18, 2025 FOMC meeting, the Fed is widely expected to maintain the federal funds rate at 4.25 %–4.50 % (centered at 4.5 %)—unchanged for the third consecutive session.
Markets currently assign ~99 % odds to a hold, with slight probability (≈12 % by July, rising to ~62 % by September) for a cut, according to futures
🔴 Hikes and pauses: mixed to muted
- During the aggressive 2022‑23 hiking cycle (+525 bps from Mar 2022 to Jul 2023), inflation slowed from ~6.6 % to ~2.6 % by March 2025, with equities fluctuating.
- On Fed pauses—such as recent quarter‑point holds—the stock market often sees short-term relief but can stall absent further easing
🟠 Hike surprises: bond shock 1994
In 1994, an unexpected 25 bp hike triggered a bond market crash ($1.5 tr illion loss globally), spiking volatility .
2. Key past FOMC decisions & market reactions
| Date | Decision | Equities/Bonds Reaction |
| Dec 16 2008 | Emergency cut to 0–0.25 % | Equities sharply reversed down‑trend; bonds surged |
| Dec 2015 – Dec 2018 | Gradual hikes to 2.5 % | Equities moderately hit, especially rate‑sensitive sectors |
| Mar 3/15 2020 | Emergency cuts to 0.25 % | Equity and bond market rebound amid pandemic shock |
| Apr 2–4 2025 | Tariff‑triggered crash mid‑cycle | S&P dropped ~10 %, then rebounded 9.5 % in one day |
3. Today’s market signals & expectations
- Inflation softening: CPI rose only 0.1 % and import prices are flat. Soft data hint at a more dovish bias
- ·· Economic warning signals: Home‑builder confidence, industrial output, and building‑materials sales have been weakening.
- ·· Geopolitical variables: Recent Trump‑era tariffs and Middle‑East tensions are pressuring prices and sentiment .
4. What markets might do today
- Currently, QQQ and SPY are down ~0.9 %, while TLT is up ~1.2 %, suggesting a safe‑haven tilt ahead of the announcement.
- If the Fed holds—and signals patience—it could fuel a modest stock rally with bond yields dipping.
- A surprise hawkish tone, however—warned by Powell regarding inflation or labor strength—could trigger a bond sell‑off and equity dip.
5. Are surprises likely?
- Unlikely: The Fed has telegraphed a steady stance; futures expect a hold.
- Potential wildcards: Powell could change path if he emphasizes persistent inflation risks or lowers the projected rate‑cut frequency for 2025—a scenario backed by today’s hawkish shift narrative
6. Breakeven scenarios & outlook
If the Fed holds + offers dovish guidance:
- Equities likely climb, especially growth & tech—Analyst Tom Lee forecasts S&P 500 reaching 6,600 by year‑end.
- Bonds tighten (yields down), TLT likely to outperform.
If tone is hawkish or cautious:
- Equities flatten or dip; rate-sensitive sectors underperform.
- Bonds yields spike; TLT loses ground.
If they cut:
- Markets rally strongly—historical data show ~11 % 12‑month S&P gain post‑cut.
- Likely window: September is favored, per futures pricing and Fed dot‑plot .
Big picture:
Today’s decision to remain at 4.5 % is the path of least resistance. Markets expect it. The key driver lies in the Fed’s language: embrace dovish tones and forward rate cuts, equities rally; underscore inflation or labor strength, and bonds sell off. Historical trends show cutting cycles boost equities, hiking triggers choppy waters, and pauses alone are neutral to mildly positive. With macro data suggesting cooling inflation and weakening economic momentum, odds favor eventual easing—perhaps by September—giving equities conditional tailwinds into year‑end.
Traders should watch:
- Fed’s dot‑plot updates.
- Powell’s press‑conference signals.
- Early jobless claims, PCE & CPI ahead.
In this shifting regime of slower growth and occasional volatility jolts, today’s decision is what markets expect—but the language that comes with it could be what defines 2025’s second half.
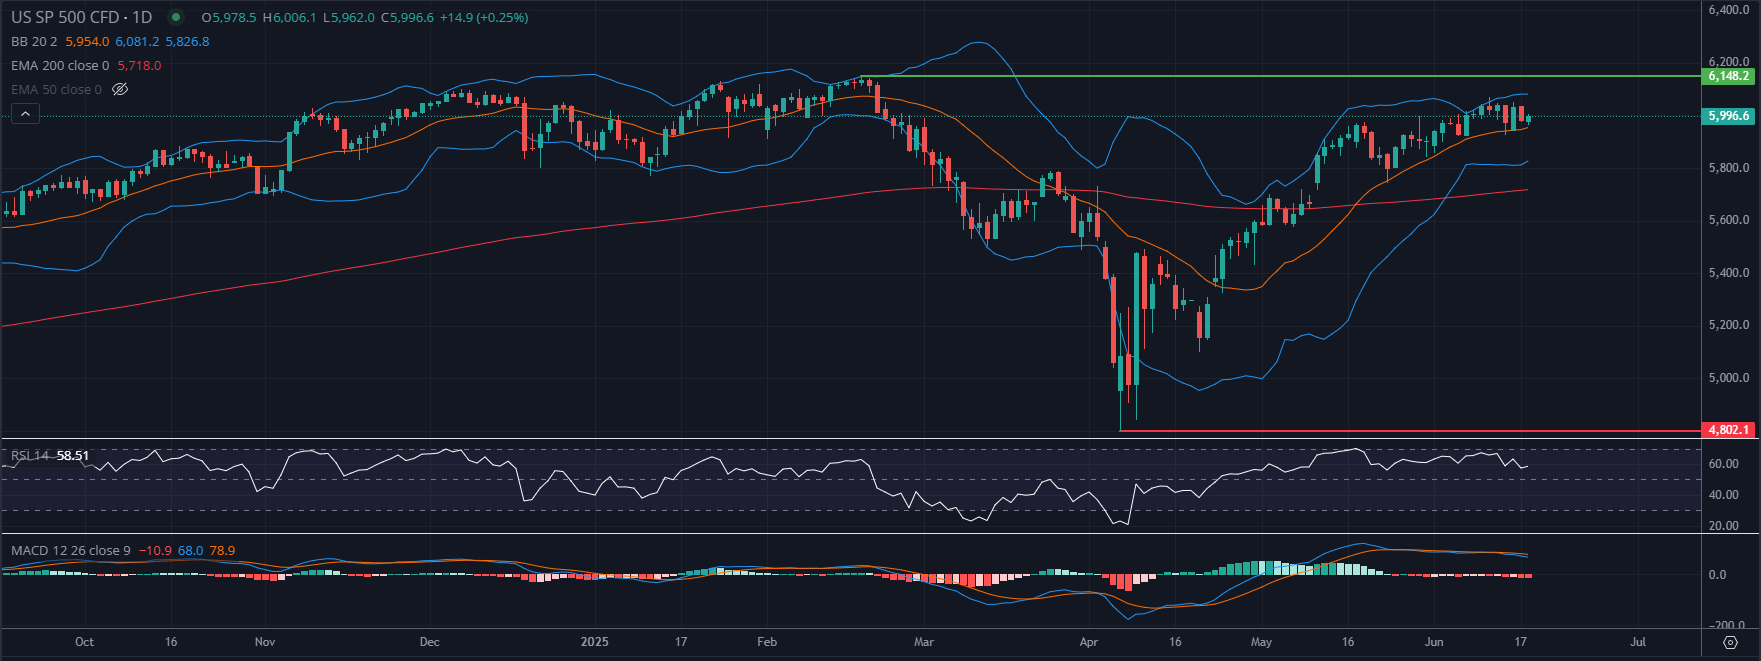
S&P 500 Technical Analysis 1 Day
1. Price action near resistance
- S&P500/SPY/SPX is hovering just below all-time highs around 6,148–6,150 (index equivalent)
- Price has recently rebounded off this level and has been moving slightly lower for the past 8 days, indicating sellers defending the top.
2. Momentum and oscillator signals
- MACD is flattening: histogram bars have shrunk but remain above zero — a sign of waning bullish momentum, not yet reversal.
- Daily RSI sits in mid‑50s (~58), indicating no extreme overbought/oversold conditions and uncertainty over direction of strength.
- Stoch‑RSI (4‑hour) was flirting with overbought, recently faded — hinting at a short-term cool‑off or consolidation.
3. Moving averages
- The 50‑day EMA is above the 200‑day EMA (a bullish “golden cross on 19th May”), and price remains above both.
- On intraday charts, price briefly slipped below the 20-EMA after touching resistance, then found near-term support at the 50-EMA, indicating short-term stabilization.
4. Bollinger Bands
- Daily imploded slightly—bands tightened around highs, and candles are hugging the top band, potentially showing a move toward the mid/Bollinger mean is possible.
🔄 Trading Scenarios
- Bullish Breakout
- A decisive move above ~6,150 on strong volume could trigger renewed upside — next potential target could be the psychological level of 6,200.
- Consolidation / Pullback
- Likely in a narrow range between the Bollinger bands 6,100–5,800, supported by fading short-term momentum.
- Deeper Pullback
- A slide below the 50-EMA may lead to a drop toward the 200-day EMA zone (~5,800), showing a larger correction.
We will keep you updated for more.
--With regards by Philip Papageorgiou – Market Analyst
-Follow me on X ex Twitter: PhilipForexCom
Related tags:
Latest market news




The complete CFD trading experience
Award-winning platforms, competitive spreads, low commissions and dedicated support.
We live and breathe the markets and are dedicated to helping traders realise their ambitions as we continue to set the industry bar.
Economic calendar
Web Trader platform
Our sophisticated web-based platform is packed with features.
Related articles

S&P 500, Nasdaq, Dow Forecast: Wall Street Split Widens Into Month-End 9 26 2026
Nasdaq strength contrasts with mounting Dow pressure as rising Treasury yields raise the stakes for stocks heading into the monthly close.


Equity Indices Q4, 2026 Outlook: Cracks Begin to Show
There's still an open door for a melt-up in the S&P 500 and Nasdaq but the Dow and Russell 2000 are looking more vulnerable, and until calm hits the Treasuries market there's a higher probability for volatility. The big question is whether that's a next quarter theme or not.


S&P 500 Forecast: SPX rises as oil prices fall, but treasuries remain at multi-decade highs
U.S. stocks are rising on Friday after a volatile week that saw a surge in Treasury yields ripple through financial markets.

StoneX Europe Ltd may make third party material available on this website which may contain information included but not limited to the conditions of financial markets. The material is for information purposes only and does not contain, and should not be construed as containing, investment advice and/or investment recommendation and/or an investment research and/or an offer of or solicitation for any transactions in financial instruments; any decision to enter into a specific transaction shall be made by the client following an assessment by him/her of their situation.
StoneX Europe Ltd makes no representation or warranty and assumes no liability as to the accuracy or completeness of the information provided, nor any loss arising from any investment based on a recommendation, forecast or other information supplied. You should always seek independent advice as to your suitability to speculate in any related markets and your ability to assume the associated risks, if you are at all unsure. We are not under any obligation to update any such material. Any opinion made may be personal to the author and may not reflect the opinion of StoneX Europe Ltd.