




Strong correlation between USDCAD and BTC
Currency traders can use this relationship between the 2 assets as another tool.
Share this:

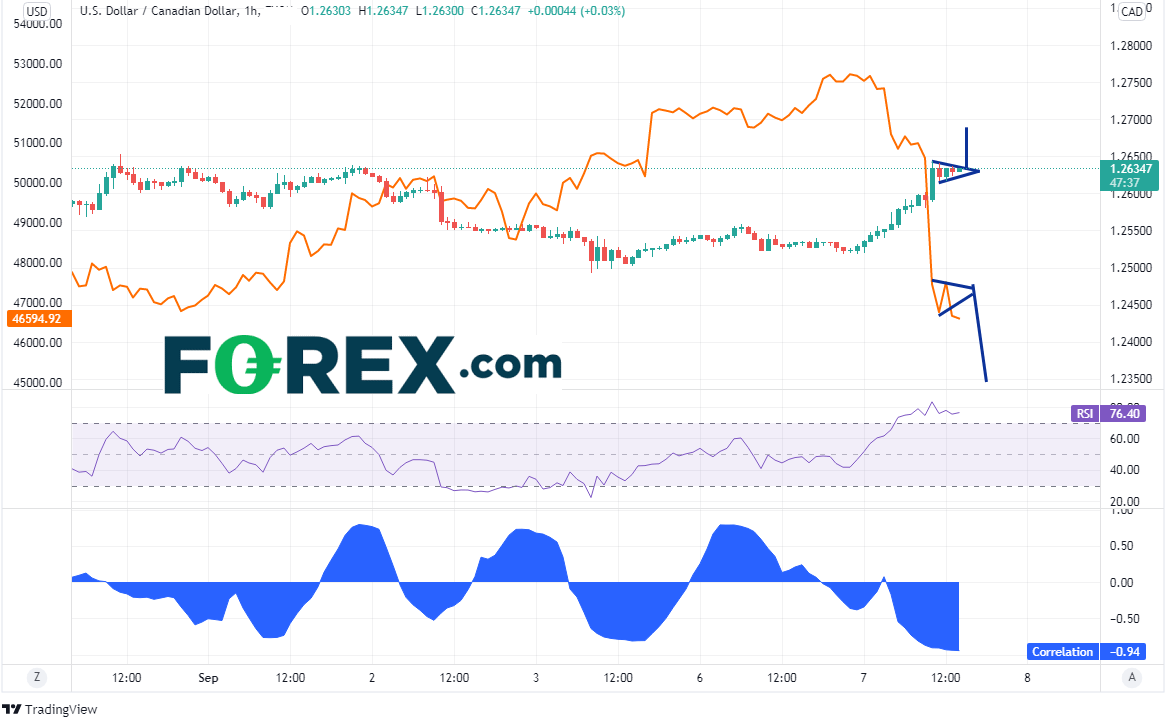
Check out the 1-hour price chart of USD/CAD below. Earlier this morning, USD/CAD made a quick move higher from 1.2590 to 1.2643, Price has been consolidating near the highs, creating a short-term pennant formation, while the RSI tries to unwind from overbought territory, currently at 76.40. The target for the pennant formation is near 1.2690.
Source: Tradingview, Stone X
Overlaid on the USD/CAD chart is the price action for Bitcoin (orange line). The 2 assets have been inversely related as of late. Therefore, as Bitcoin trades higher, USD/CAD has been trading lower, and vice-versa. Also notice at the bottom of the chart is the correlation coefficient between USD/CAD and Bitcoin. This measures the strength of the relationship in the direction of the move between the 2 assets. It is currently -0.94! For reference, a reading of -1.00 is a perfect negative correlation, meaning they will move in opposite directions 100% of the tme. -0.94 is pretty close!
CORRELATION MEASURES DIRECTION, NOT MAGNITUDE. One should not assume that if BTC has a monster move in one direction, that USD/CAD will have a monster move in the opposite direction, only that it should move in the opposite direction based on the 1-hour correlation.
The target for Bitcoin based on the pennant formation lower today is near 45,000. If the cryptocurrency completes the move to target, USD/CAD should be on its way higher. Currency traders can use this relationship between the 2 assets as another tool. If BTC is to continue moving lower, traders may consider a long in USD/CAD given the current correlation.
Note that this is only a 1-hour chart. The correlation is weaker on longer-term time frames. Also, as one can see from the volatility of the correlation coefficient, it changes over time. It is best to use this indicator when it is above +0.80 or below -0.80.
Learn more about forex trading opportunities.
Check out the 1-hour price chart of USD/CAD below. Earlier this morning, USD/CAD made a quick move higher from 1.2590 to 1.2643, Price has been consolidating near the highs, creating a short-term pennant formation, while the RSI tries to unwind from overbought territory, currently at 76.40. The target for the pennant formation is near 1.2690.
Source: Tradingview, Stone X
Overlaid on the USD/CAD chart is the price action for Bitcoin (orange line). The 2 assets have been inversely related as of late. Therefore, as Bitcoin trades higher, USD/CAD has been trading lower, and vice-versa. Also notice at the bottom of the chart is the correlation coefficient between USD/CAD and Bitcoin. This measures the strength of the relationship in the direction of the move between the 2 assets. It is currently -0.94! For reference, a reading of -1.00 is a perfect negative correlation, meaning they will move in opposite directions 100% of the tme. -0.94 is pretty close!
CORRELATION MEASURES DIRECTION, NOT MAGNITUDE. One should not assume that if BTC has a monster move in one direction, that USD/CAD will have a monster move in the opposite direction, only that it should move in the opposite direction based on the 1-hour correlation.
The target for Bitcoin based on the pennant formation lower today is near 45,000. If the cryptocurrency completes the move to target, USD/CAD should be on its way higher. Currency traders can use this relationship between the 2 assets as another tool. If BTC is to continue moving lower, traders may consider a long in USD/CAD given the current correlation.
Note that this is only a 1-hour chart. The correlation is weaker on longer-term time frames. Also, as one can see from the volatility of the correlation coefficient, it changes over time. It is best to use this indicator when it is above +0.80 or below -0.80.
Related tags:
Latest market news


The complete CFD trading experience
Award-winning platforms, competitive spreads, low commissions and dedicated support.
We live and breathe the markets and are dedicated to helping traders realise their ambitions as we continue to set the industry bar.
Economic calendar
Web Trader platform
Our sophisticated web-based platform is packed with features.
Related articles
USD Sets Fresh Yearly High as EUR/USD Drops Dramatically, USD/JPY Stable
Well, it was a week of USD strength that wasn’t entirely pushed by USD/JPY, as a strong sell-off in EUR/USD has pushed the major pair to its most oversold state in a decade.
USD Sets Fresh Yearly High as EUR/USD Drops Dramatically, USD/JPY Stable
Well, it was a week of USD strength that wasn’t entirely pushed by USD/JPY, as a strong sell-off in EUR/USD has pushed the major pair to its most oversold state in a decade.
Dow Jones Slide Shows What Rate Hike Bets Mean for Stocks
The Dow Jones support breakdown shows rising bond yields and rate hike bets hitting U.S. stocks while tech giants prop up the Nasdaq.

StoneX Europe Ltd may make third party material available on this website which may contain information included but not limited to the conditions of financial markets. The material is for information purposes only and does not contain, and should not be construed as containing, investment advice and/or investment recommendation and/or an investment research and/or an offer of or solicitation for any transactions in financial instruments; any decision to enter into a specific transaction shall be made by the client following an assessment by him/her of their situation.
StoneX Europe Ltd makes no representation or warranty and assumes no liability as to the accuracy or completeness of the information provided, nor any loss arising from any investment based on a recommendation, forecast or other information supplied. You should always seek independent advice as to your suitability to speculate in any related markets and your ability to assume the associated risks, if you are at all unsure. We are not under any obligation to update any such material. Any opinion made may be personal to the author and may not reflect the opinion of StoneX Europe Ltd.