





Stronger PPI after firmer CPI DJIA
Although the higher than expected CPI pushed the DJIA lower yesterday, the stronger than expected PPI today was ignored
Share this:
The Producer Price Index (PPI) and Consumer Price Index (CPI) go hand in hand, like 2 peas in a pod. PPI is the cost of materials used to create products, which include such items as building materials, airline passenger services, and fuel. CPI is the cost which the consumer pays for the products, and includes shelter, airline prices, and automobiles. In theory, the prices in the PPI should be passed through to the consumer, which would result in a higher CPI in the near future.
Here’s more info…
Let’s focus on the headline MoM data. March’s headline PPI (MoM) was 1%. In theory, this should pass through to the CPI. The timing depends on how long it takes for consumers to buy the products. FOR April’s CPI, one would expect it to increase if the products were sold within a month. Indeed, the April headline CPI (MoM) was 0.8% vs an average expectation of surveyed economists of 0.2%. This was a much stronger print than expected! Thus, the market assumes headline inflation is higher than expected as well.
Learn more about economic indicators
The April reading…..
The headline PPI for April (MoM) was 0.6% vs an expectation of 0.3%. This price increase should, in theory, pass through to the May CPI print. Economists will use this print (and whatever other data they use) to help determine expectations for the May CPI. There is also a “Core” PPI and CPI, which excludes food prices and energy prices, as the Fed considers these inputs to be too volatile. (Apparently, Fed members don’t eat or drive.) Therefore, when traders are trying to consider what actions the Fed may take next, they should give more attention to this print, because the Fed does.
As mentioned, the headline PPI (MoM) for April was 0.6% vs 0.3% expected. The Core PPI (MoM) was 0.7% vs 0.4% expected, also stronger. The headline PPI (YoY) print was 6.2% vs 5.9% and the Core PPI (YoY) print was 4.1% vs 3.7% expected. The YoY prints are used to see how prices have moved since last year, however, remember that last spring prices shot higher as the US was released from lockdown. Therefore, there is a “quirk” in the current YoY data.
Dow Jones
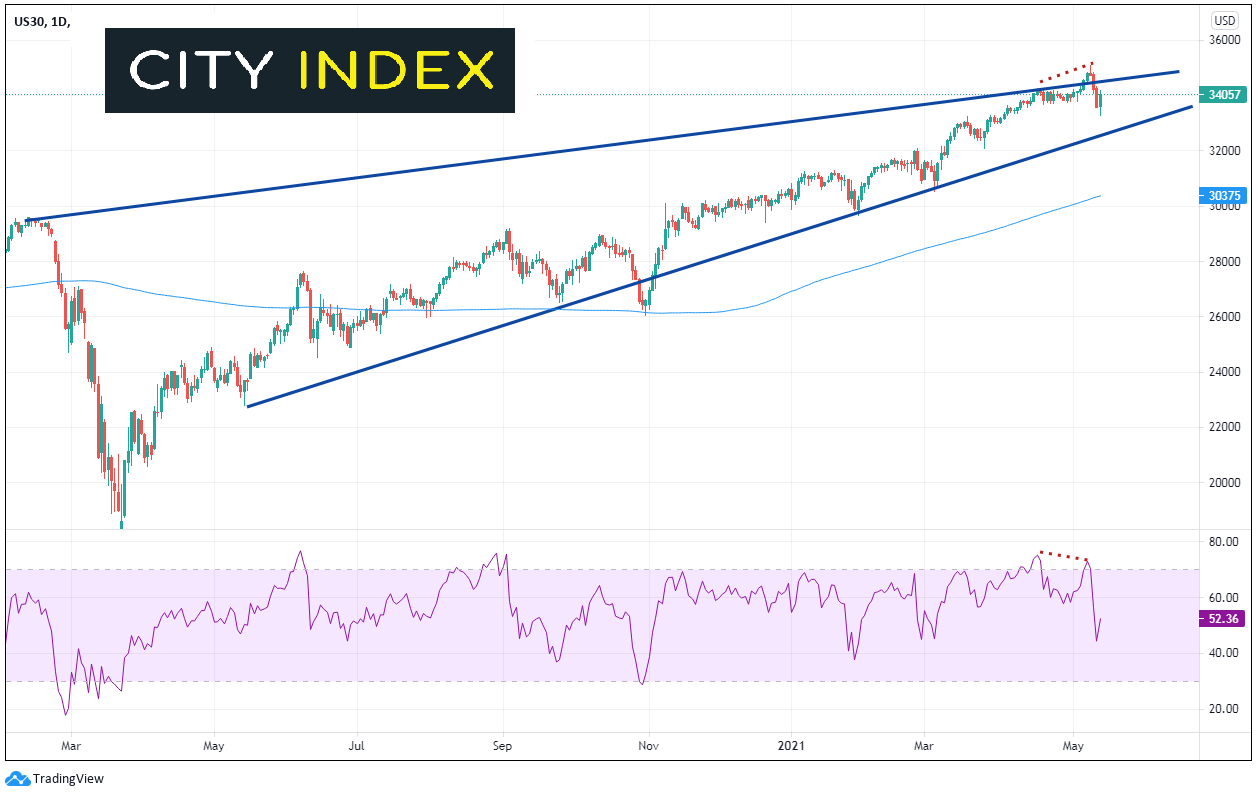
The Dow Jones Industrial Average, like so many other stock indices, has been on a tear since putting in pandemic lows in March 2020. The major US stock market average has been moving higher in an ascending wedge formation. The Dow make a false break below the bottom trendline of the wedge in the Fall of 2020. The index moved back into the range testing the bottom trendline several more times, before moving higher and testing the top trendline in mid-April. In early May, the Dow Jones broke above the top trendline and formed a shooting star candlestick, along with a diverging RSI in overbought territory. This was a strong indication the Dow may be ready for a pullback. Indeed, the shooting star led to a price move back inside the wedge and price is looking to test the bottom trendline once again.
Source: Tradingview, City Index
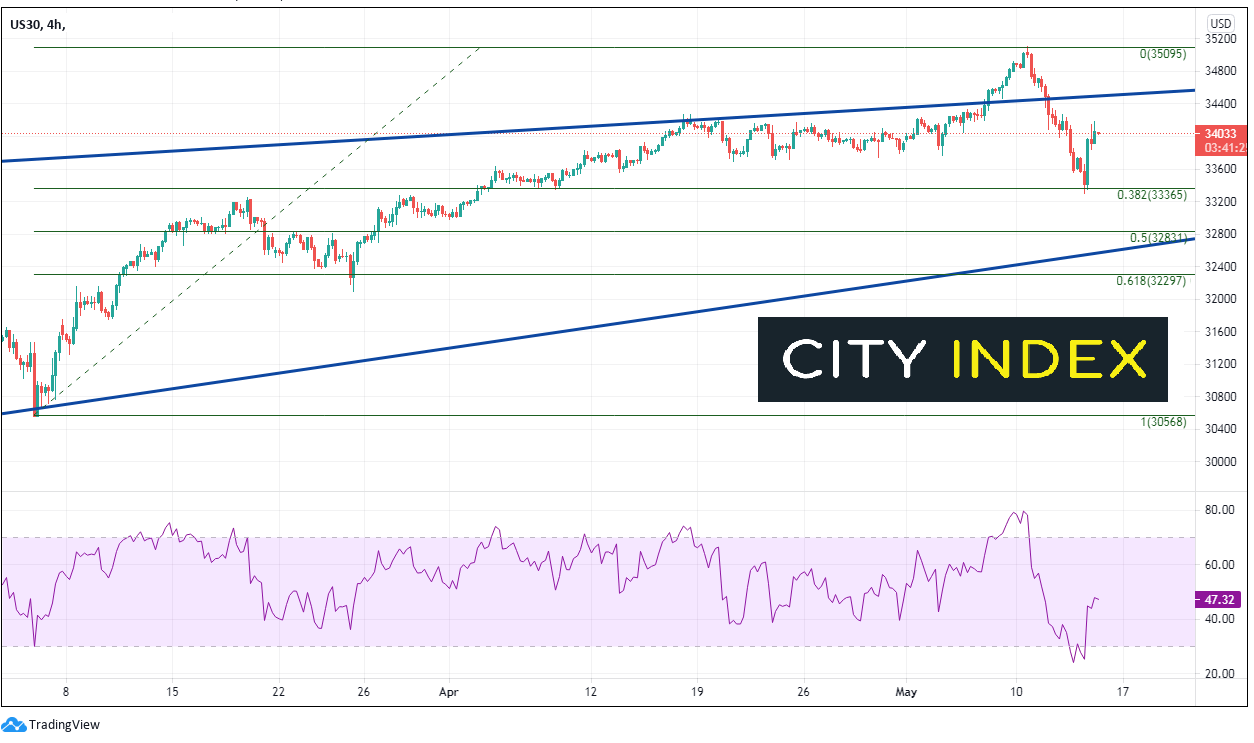
After the poor NFP data on Friday and the higher than expected CPI on Wednesday, price moved to the 38.2% Fibonacci retracement level from the lows of March 4th to the highs of May 10th. On Thursday, price bounced on the 240-minute timeframe and profit taking ensued. The higher than expected PPI failed to push prices lower, as the RSI was in oversold territory. Resistance is at the long-term, upper trendline of the wedge, near 34500. Above there, price can test the all-time highs of 35102. Support is back at May 13th lows and the previously mentioned 38.2% Fibonacci retracement level, near 33365. Below there is the 50% retracement level from the same time period near 32831 and then the bottom, upward sloping trendline of the wedge near 32500.
Source: Tradingview, FOREX.com
Although the higher than expected CPI data pushed the Dow Jones Industrial Average lower yesterday, the stronger than expected PPI today was ignored. The stock index moved higher as the RSI was in oversold territory. The May reading of both CPI and PPI will be released before the next FOMC meeting on June 16th. Therefore, the Fed will have 2 inflation data prints just before their meeting. Traders will be watching for clues in the data as to when the Fed may begin to taper.
Learn more about index trading opportunities.
The Producer Price Index (PPI) and Consumer Price Index (CPI) go hand in hand, like 2 peas in a pod. PPI is the cost of materials used to create products, which include such items as building materials, airline passenger services, and fuel. CPI is the cost which the consumer pays for the products, and includes shelter, airline prices, and automobiles. In theory, the prices in the PPI should be passed through to the consumer, which would result in a higher CPI in the near future.
Here’s more info…
Let’s focus on the headline MoM data. March’s headline PPI (MoM) was 1%. In theory, this should pass through to the CPI. The timing depends on how long it takes for consumers to buy the products. FOR April’s CPI, one would expect it to increase if the products were sold within a month. Indeed, the April headline CPI (MoM) was 0.8% vs an average expectation of surveyed economists of 0.2%. This was a much stronger print than expected! Thus, the market assumes headline inflation is higher than expected as well.
Learn more about economic indicators
The April reading…..
The headline PPI for April (MoM) was 0.6% vs an expectation of 0.3%. This price increase should, in theory, pass through to the May CPI print. Economists will use this print (and whatever other data they use) to help determine expectations for the May CPI. There is also a “Core” PPI and CPI, which excludes food prices and energy prices, as the Fed considers these inputs to be too volatile. (Apparently, Fed members don’t eat or drive.) Therefore, when traders are trying to consider what actions the Fed may take next, they should give more attention to this print, because the Fed does.
As mentioned, the headline PPI (MoM) for April was 0.6% vs 0.3% expected. The Core PPI (MoM) was 0.7% vs 0.4% expected, also stronger. The headline PPI (YoY) print was 6.2% vs 5.9% and the Core PPI (YoY) print was 4.1% vs 3.7% expected. The YoY prints are used to see how prices have moved since last year, however, remember that last spring prices shot higher as the US was released from lockdown. Therefore, there is a “quirk” in the current YoY data.
Dow Jones
The Dow Jones Industrial Average, like so many other stock indices, has been on a tear since putting in pandemic lows in March 2020. The major US stock market average has been moving higher in an ascending wedge formation. The Dow make a false break below the bottom trendline of the wedge in the Fall of 2020. The index moved back into the range testing the bottom trendline several more times, before moving higher and testing the top trendline in mid-April. In early May, the Dow Jones broke above the top trendline and formed a shooting star candlestick, along with a diverging RSI in overbought territory. This was a strong indication the Dow may be ready for a pullback. Indeed, the shooting star led to a price move back inside the wedge and price is looking to test the bottom trendline once again.
Source: Tradingview, FOREX.com
After the poor NFP data on Friday and the higher than expected CPI on Wednesday, price moved to the 38.2% Fibonacci retracement level from the lows of March 4th to the highs of May 10th. On Thursday, price bounced on the 240-minute timeframe and profit taking ensued. The higher than expected PPI failed to push prices lower, as the RSI was in oversold territory. Resistance is at the long-term, upper trendline of the wedge, near 34500. Above there, price can test the all-time highs of 35102. Support is back at May 13th lows and the previously mentioned 38.2% Fibonacci retracement level, near 33365. Below there is the 50% retracement level from the same time period near 32831 and then the bottom, upward sloping trendline of the wedge near 32500.
Source: Tradingview, FOREX.com
Although the higher than expected CPI data pushed the Dow Jones Industrial Average lower yesterday, the stronger than expected PPI today was ignored. The stock index moved higher as the RSI was in oversold territory. The May reading of both CPI and PPI will be released before the next FOMC meeting on June 16th. Therefore, the Fed will have 2 inflation data prints just before their meeting. Traders will be watching for clues in the data as to when the Fed may begin to taper.
Learn more about index trading opportunities.
Related tags:
Latest market news




The complete CFD trading experience
Award-winning platforms, competitive spreads, low commissions and dedicated support.
We live and breathe the markets and are dedicated to helping traders realise their ambitions as we continue to set the industry bar.
Economic calendar
Web Trader platform
Our sophisticated web-based platform is packed with features.
Related articles
AUD/USD outlook: Aussie slips despite hawkish RBA ahead of key data
The AUD/USD was unable to benefit from the Reserve Bank of Australia’s 25-basis-point rate hike overnight. The RBA lifted the cash rate to 4.60%, in line with expectations. However, the Australian dollar weakened following the decision, with much of the Bank’s hawkish stance seemingly priced in ahead of the announcement. The US dollar has also remained largely supported following the recent turmoil in the bond markets.


RBA delivers 25bp hike, Bullock now the main event
The RBA delivered the expected 25bp hike, but Bullock’s press conference now looms as the bigger volatility risk for AUD/USD and the ASX 200.


Gold outlook: XAU/USD hammered, stretched and vulnerable to a sharp rebound
Gold is getting hammered for solid fundamental reasons, but history suggests extreme four-hourly oversold conditions can produce violent countertrend rallies.
StoneX Europe Ltd may make third party material available on this website which may contain information included but not limited to the conditions of financial markets. The material is for information purposes only and does not contain, and should not be construed as containing, investment advice and/or investment recommendation and/or an investment research and/or an offer of or solicitation for any transactions in financial instruments; any decision to enter into a specific transaction shall be made by the client following an assessment by him/her of their situation.
StoneX Europe Ltd makes no representation or warranty and assumes no liability as to the accuracy or completeness of the information provided, nor any loss arising from any investment based on a recommendation, forecast or other information supplied. You should always seek independent advice as to your suitability to speculate in any related markets and your ability to assume the associated risks, if you are at all unsure. We are not under any obligation to update any such material. Any opinion made may be personal to the author and may not reflect the opinion of StoneX Europe Ltd.