



The yuan hits a 14-year low and sends USD/CNH above 7.2000
Another day, another big level gives way for global markets. And that has seen the yuan weaken to 7.2 against the US dollar, a level not seen since 2008.
Share this:

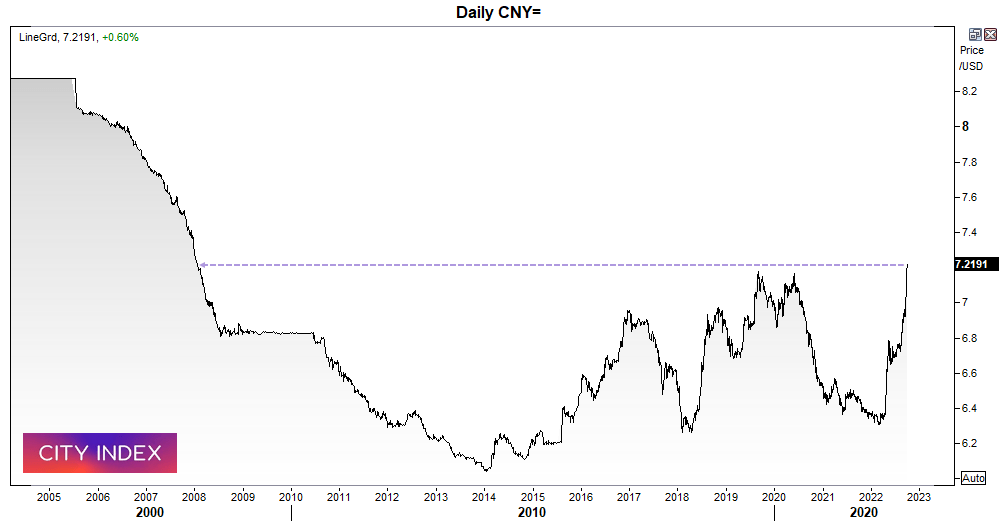
The PBOC (People’s Bank of China) continued to let the yuan slide and set their central parity rate -385 pips lower - to its weakest level since 2020. The central bank can control the direction volatility of the currency, which allows a daily fluctuation of +/-0.3% around the parity rate. This allowed USD/CNY to rise above 7.2 for the first time since 2008. However, they have less control over CNH (offshore yuan) which saw USD/CNH rise to just shy of 7.2500, which suggests speculators continue to believe the PBOC will let the currency slide.
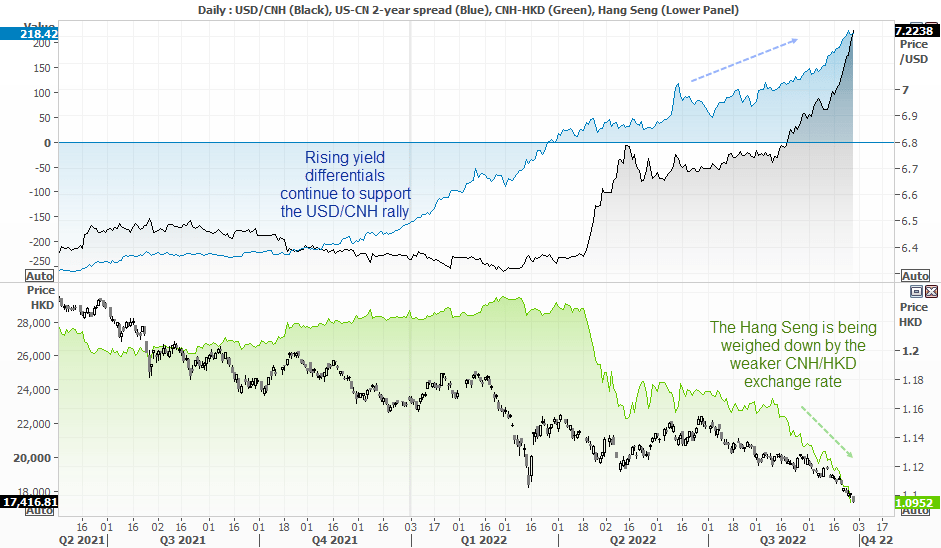
We can see below that yield differentials between US and CN continues to support the higher USD/CNH. And that should not come as a surprise, given the divergent policies between the Fed and PBOC. But is should be noted that there is more to this than just USD/CNH, as it has global implications and can weigh on risk sentiment. The weaker yuan pressures China’s own trade partners to weaken their currencies. USD/SGD is also on a tare and reached its highest level since March 2020.
The green chart shows that CNH/HKD is within a strong downtrend, and that is adding further selling pressure on an already suffering Hang Seng (HSI). In fact, the Hang Seng has fallen to its lowest level since October 2011 and shows the potential to fall further. Ultimately, a stronger USD/CNH is bad news for Asian equity markets and to a degree US markets – and it’s no coincidence that US futures turned lower once we saw the breakout on USD/CNH.
USD/CNH 4-hour chart:
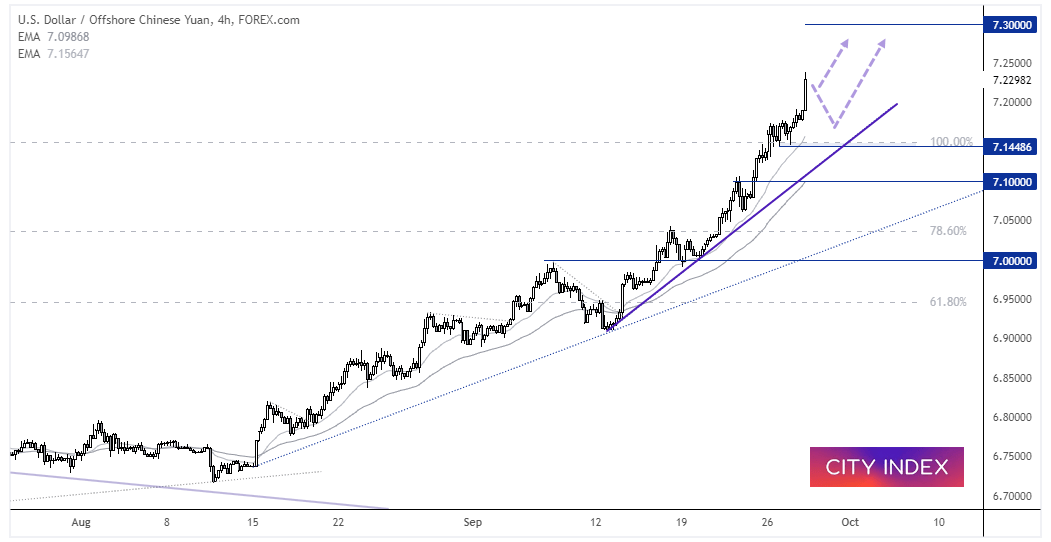
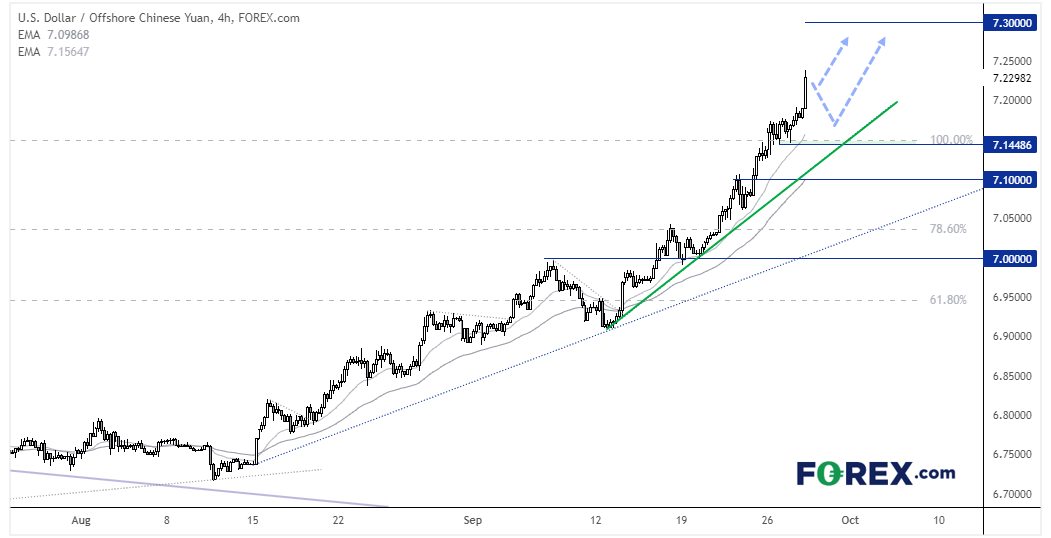
For bulls, USD/CNH is the trend that keeps on giving. It’s currently within its seventh consecutive bullish month and on track for its best month since 2005. We can see on the four-hour chat that it has reached the bullish triangle target (100% Fibonacci projection) and even used that area for support ahead of its next leg higher. It is now closer to 7.3 than it is 7.2, so bulls may want to see minor pullbacks to seek bullish setups, or somewhere along the trendline should a retracement become deeper than expected. Assuming it doesn’t just rise to 7.3 of course.
How to trade with City Index
You can easily trade with City Index by using these four easy steps:
- Open an account, or log in if you’re already a customer
• Open an account in the UK
• Open an account in Australia
• Open an account in Singapore
- Search for the company you want to trade in our award-winning platform
- Choose your position and size, and your stop and limit levels
- Place the trade
How to trade with FOREX.com
Follow these easy steps to start trading with FOREX.com today:
- Open a Forex.com account, or log in if you’re already a customer.
- Search for the pair you want to trade in our award-winning platform.
- Choose your position and size, and your stop and limit levels.
- Place the trade.
Related tags:
Latest market news




The complete CFD trading experience
Award-winning platforms, competitive spreads, low commissions and dedicated support.
We live and breathe the markets and are dedicated to helping traders realise their ambitions as we continue to set the industry bar.
Economic calendar
Web Trader platform
Our sophisticated web-based platform is packed with features.
Related articles
Silver's bullish breakout case builds as bond yields retreat
The Democratic blue wave has sent crude and Treasury yields sharply lower, improving the outlook for precious metals. With gold already breaking higher, could silver be next?
Swiss Franc Short-term Outlook: USD/CHF Selloff Nears Critical Support Ahead of NFP 11 4 2026
USD/CHF bears are closing in on critical trend support, with the next reaction likely to determine whether the October decline has further to run.

US Midterm Fallout: What Does the “Blue Tsunami” Mean for the S&P 500?
Democrats made sweeping gains in the US midterm elections, winning control of both the House and Senate - what does it mean for the S&P 500 and the AI trade?

StoneX Europe Ltd may make third party material available on this website which may contain information included but not limited to the conditions of financial markets. The material is for information purposes only and does not contain, and should not be construed as containing, investment advice and/or investment recommendation and/or an investment research and/or an offer of or solicitation for any transactions in financial instruments; any decision to enter into a specific transaction shall be made by the client following an assessment by him/her of their situation.
StoneX Europe Ltd makes no representation or warranty and assumes no liability as to the accuracy or completeness of the information provided, nor any loss arising from any investment based on a recommendation, forecast or other information supplied. You should always seek independent advice as to your suitability to speculate in any related markets and your ability to assume the associated risks, if you are at all unsure. We are not under any obligation to update any such material. Any opinion made may be personal to the author and may not reflect the opinion of StoneX Europe Ltd.