



Trade to Watch in 2026 – Dow Jones
The Dow Jones chart’s exponential rally this year, following the tariff-induced drop of April 2025, is now meeting the upper bound of a contracting trend that has been forming since the 2020 lows. Should this 5-year pattern hold, risks of a corrective drawdown emerge — warranting a cautious outlook for the Dow and for U.S. indices and markets that typically move in positive correlation heading into 2026.
Share this:

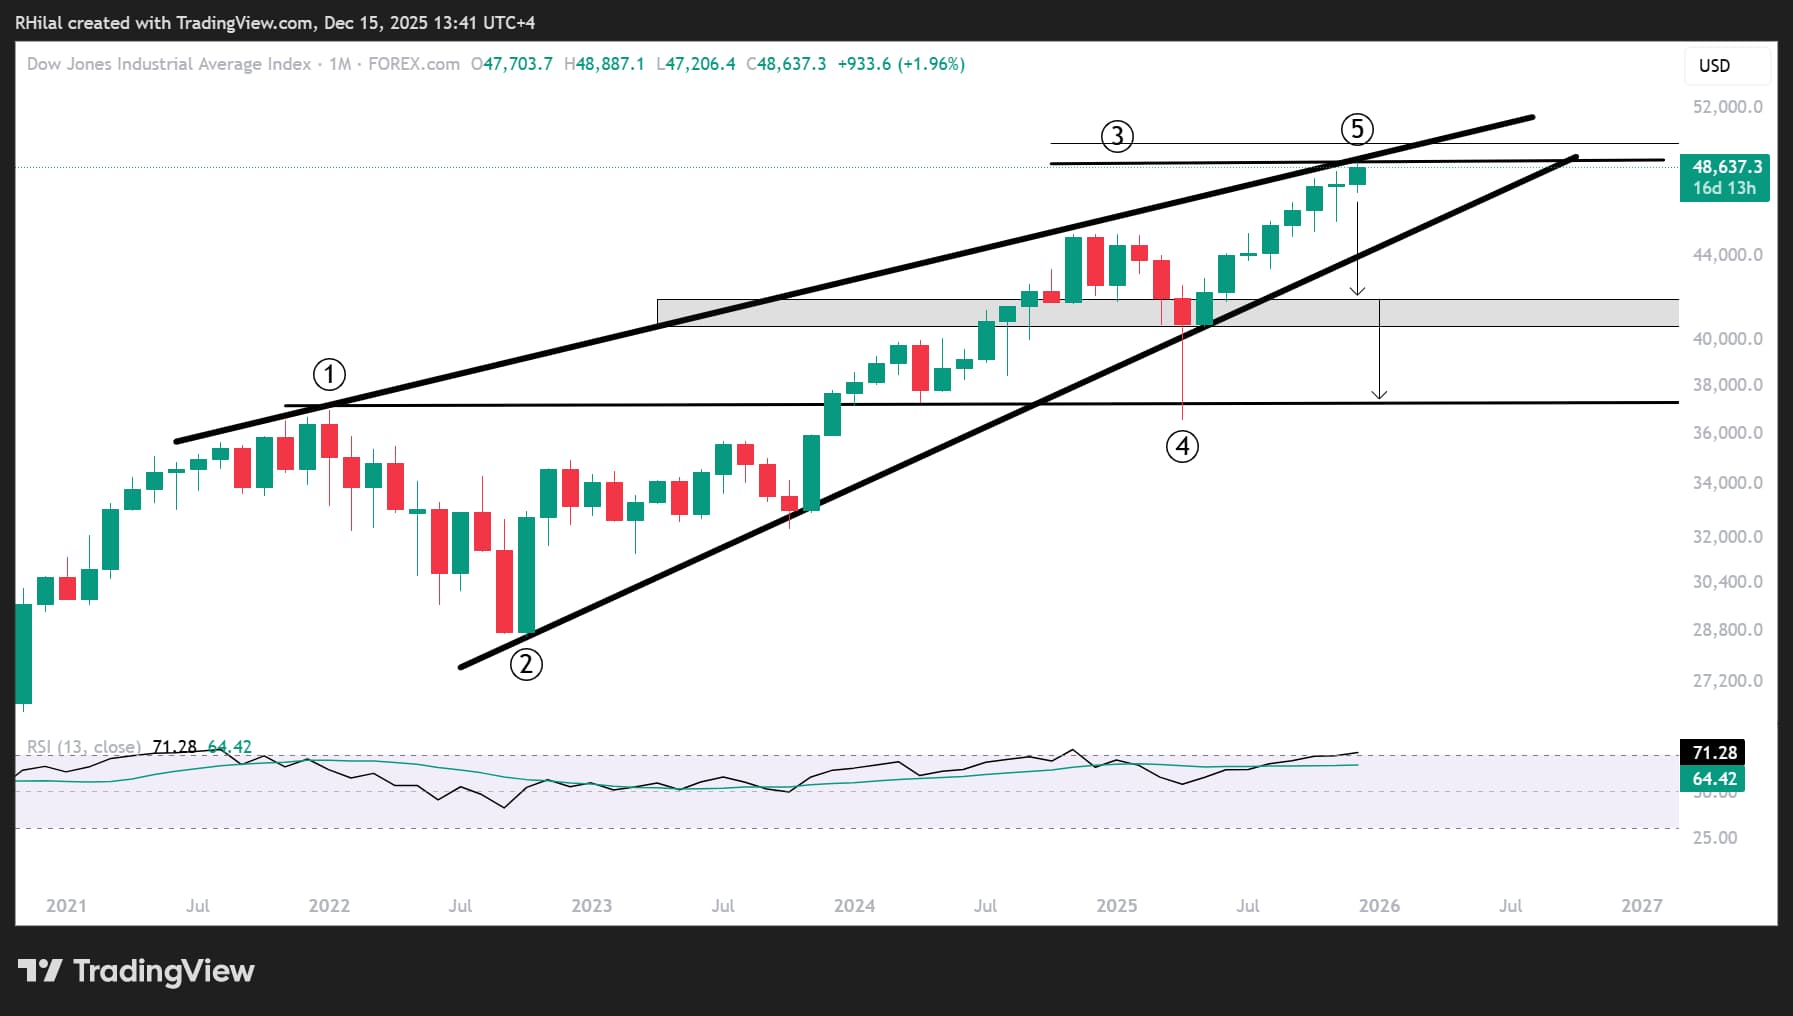
Dow Jones Outlook: Monthly Time Frame – Log Scale

Source: Trading view
After the 2025 tariff-induced decline, U.S. indices rallied more than 30%, reaching unprecedented records in line with dovish policy pressures under the Trump administration and the tech-sector surge.
However, when zooming out to the monthly time frame, a contracting price structure becomes clear, connecting the consecutive higher highs of January 2022, November 2024, and now December 2025. This diagonal-like formation presents risks of steep scenarios ahead as the Dow approaches the 50,000-checkpoint.
Dow Jones Outlook: Monthly Time Frame – Log Scale
Source: Trading view
Bearish Scenario:
If the pattern plays out as a diagonal, a steep corrective phase would be expected, consistent with diagonal characteristics, with key downside levels highlighted around 45,000, 41,700, 40,700, and 37,000, offering potential buy-the-dip opportunities.
Should this scenario unfold, markets may shift into risk-off mode, especially if policy fatigue or trend exhaustion emerges during the second year of a new presidency — a phase that historically reflects a brief market cooldown before a new bullish cycle resumes.
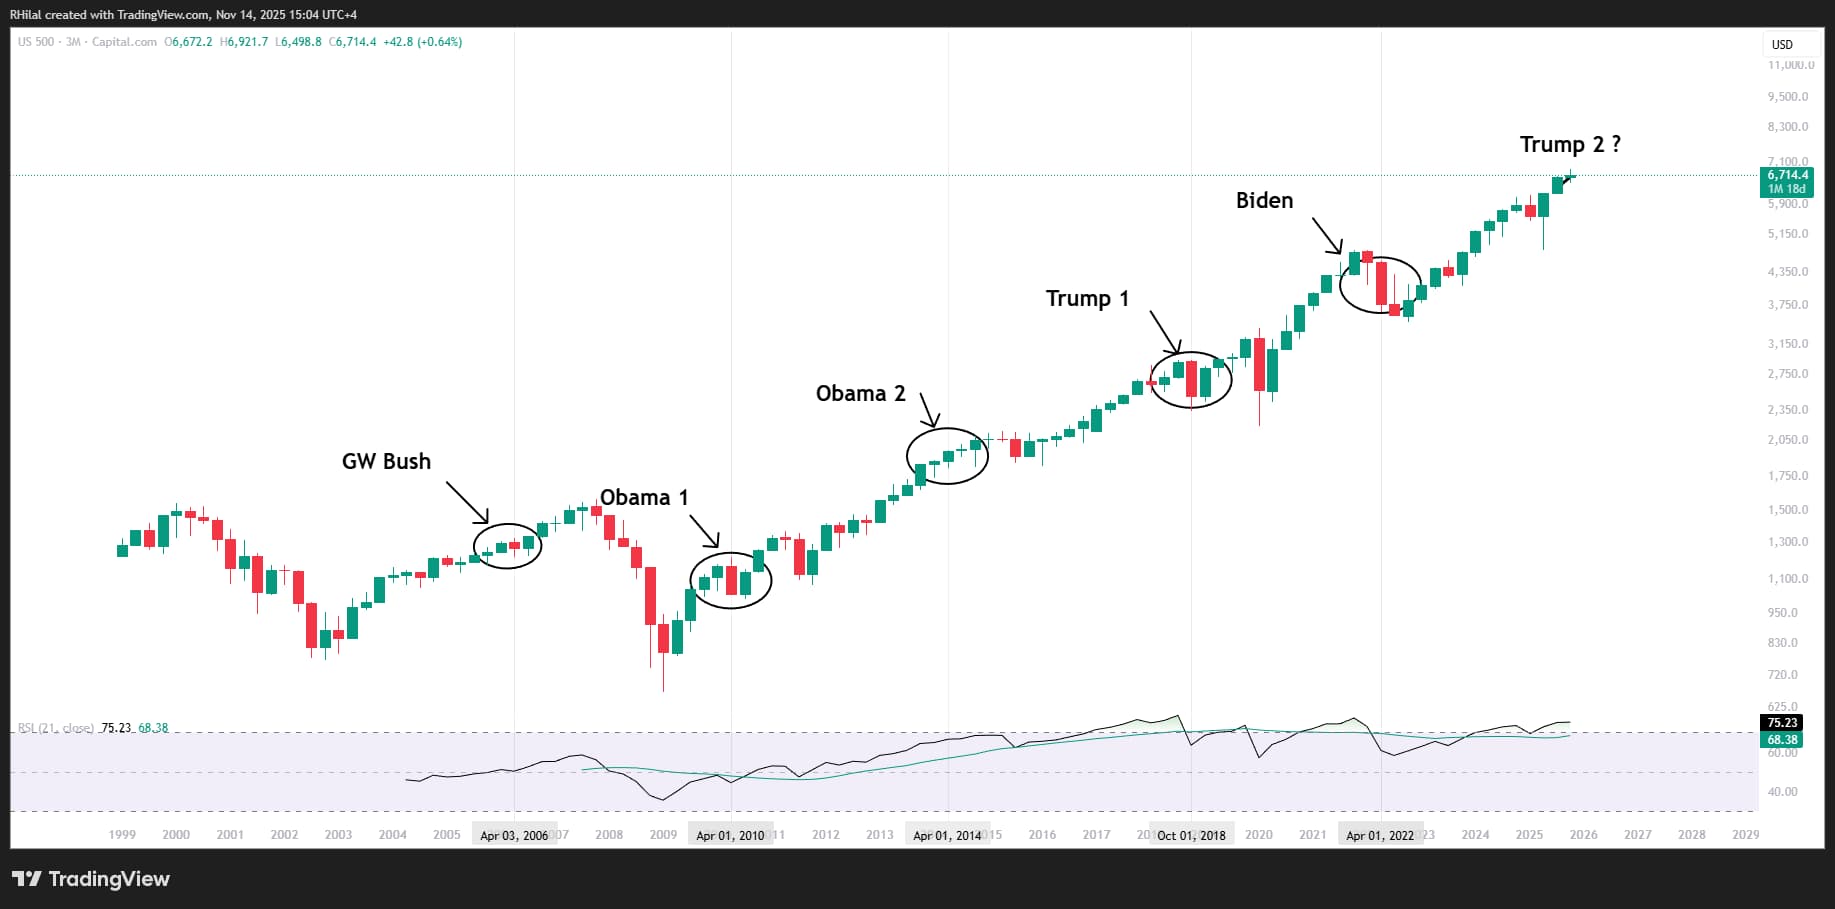
US 500 Outlook – 3 Month Chart – Log Scale
Source: Trading view
From a presidential-cycle perspective, particularly since the early 2000s, the second year of a president’s term often leans toward a corrective or consolidation phase as markets adjust to policy exhaustion and reduced momentum.
Following a steep rally driven by Trump’s return, tariff tensions, geopolitical frictions, and record-breaking momentum, caution toward a potential pullback before the trend resumes remains a valid and historically supported case.
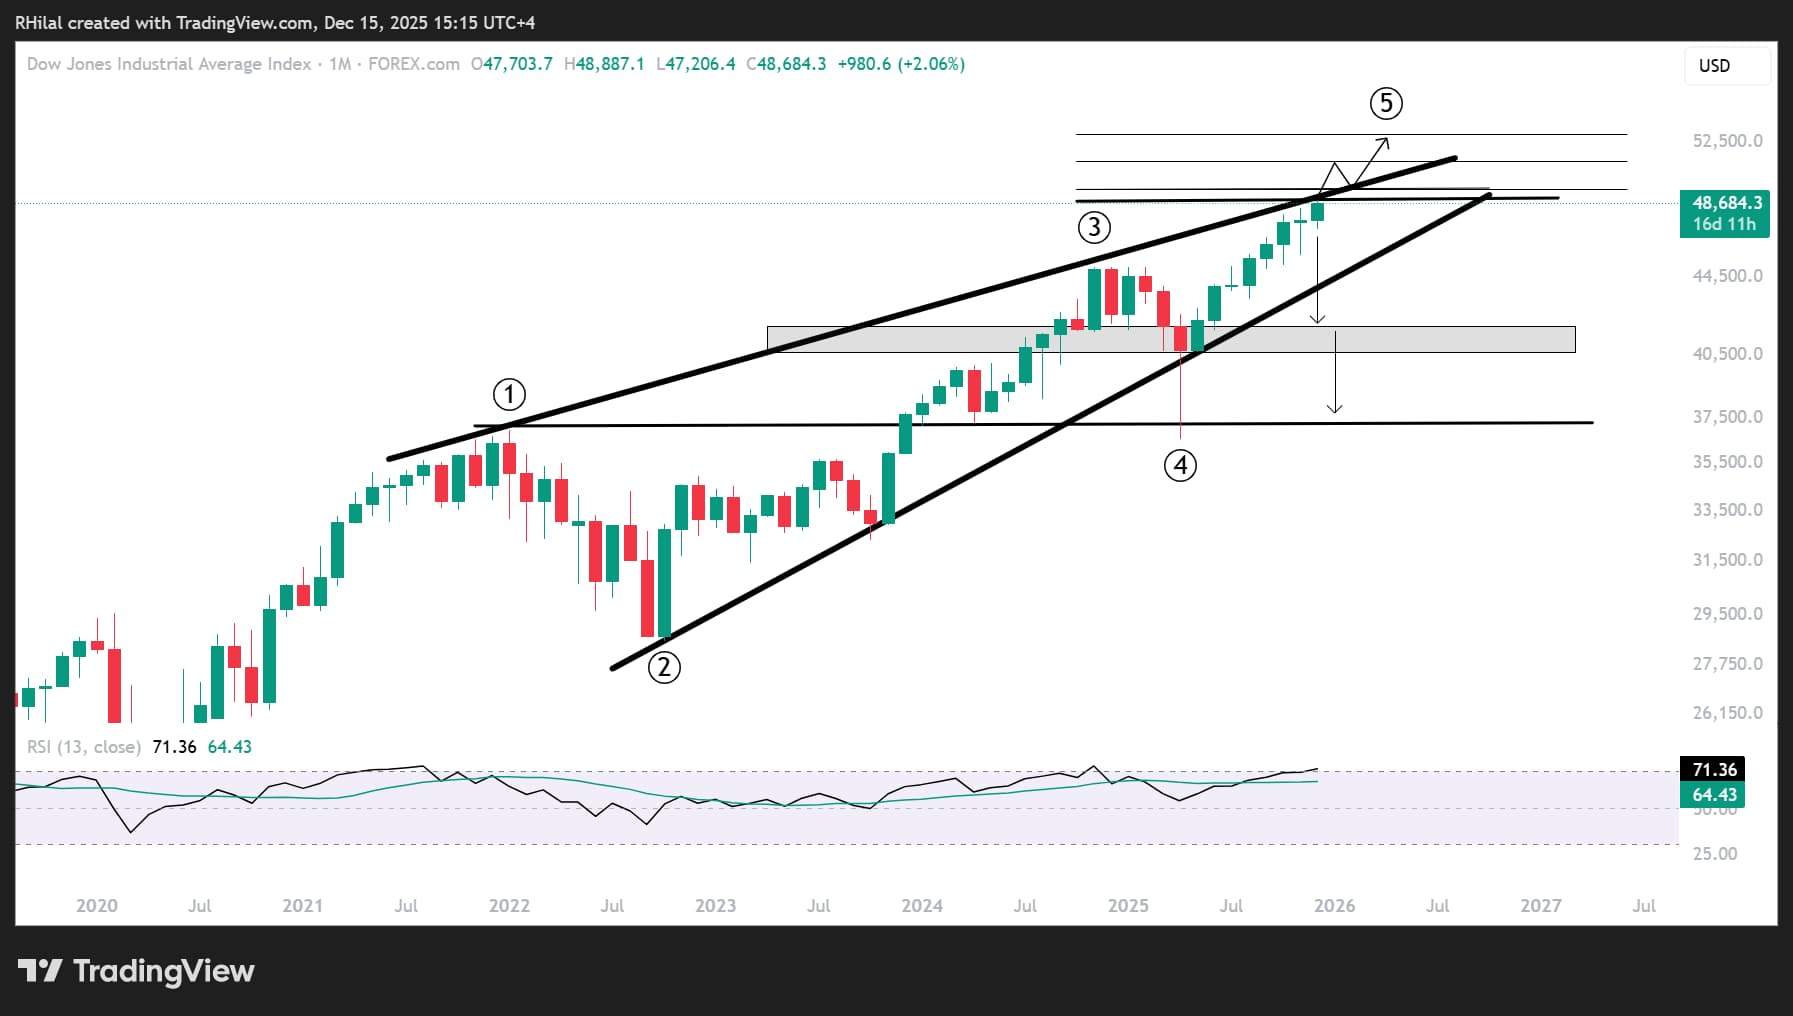
Dow Jones Outlook: Monthly Time Frame – Log Scale
Source: Trading view
Despite the bearish probabilities, the guiding principle remains: the trend is your friend, and an overbought momentum signal is not necessarily a sell trigger. A clean hold above the upper bound of the contracting structure — effectively invalidating the diagonal — would open the door to a bullish continuation.
Bullish Scenario:
From the upside, if the Dow breaks and holds above the 50,000 mark — clearing a resistance structure that has held for nearly three years — the diagonal scenario becomes less relevant, and gains may continue in line with the primary bull run and overall market risk sentiment.
Key upside levels include: 51,250, 53,000, and 57,500.
The following levels are derived using the Fibonacci extension tool between the September 2022 low, November 2024 high, and April 2025 low.
Written by Razan Hilal, CMT
Follow on X: @Rh_waves
Related tags:
Latest market news




The complete CFD trading experience
Award-winning platforms, competitive spreads, low commissions and dedicated support.
We live and breathe the markets and are dedicated to helping traders realise their ambitions as we continue to set the industry bar.
Economic calendar
Web Trader platform
Our sophisticated web-based platform is packed with features.
Related articles
Swiss Franc Forecast: USD/CHF Seven-Week Rally Reverses From Yearly Highs 10 16 2026
A sharp rejection from fresh highs has shifted momentum in favor of USD/CHF bears, raising the stakes for a critical support test.


EUR/USD, GBP/USD Price Outlook: Can the Dollar Pullback Fuel a Bullish Rebound?
Could EUR/USD and GBP/USD be confirming a bullish rebound? The DXY’s pullback from the 103 resistance level may support a recovery in both pairs, although confirmation is still needed.

DAX Rebounds, but 25,600 Remains the Level to Hold
The DAX continues to recover from last week's sell-off, supported by easing energy concerns and improving short-term momentum. While buyers have regained control of the four-hour trend, the index is now approaching a critical resistance zone between 25,450 and 25,600. A decisive break higher would strengthen the bullish case and open the door toward 25,800, while failure at resistance could quickly revive downside pressure.

StoneX Europe Ltd may make third party material available on this website which may contain information included but not limited to the conditions of financial markets. The material is for information purposes only and does not contain, and should not be construed as containing, investment advice and/or investment recommendation and/or an investment research and/or an offer of or solicitation for any transactions in financial instruments; any decision to enter into a specific transaction shall be made by the client following an assessment by him/her of their situation.
StoneX Europe Ltd makes no representation or warranty and assumes no liability as to the accuracy or completeness of the information provided, nor any loss arising from any investment based on a recommendation, forecast or other information supplied. You should always seek independent advice as to your suitability to speculate in any related markets and your ability to assume the associated risks, if you are at all unsure. We are not under any obligation to update any such material. Any opinion made may be personal to the author and may not reflect the opinion of StoneX Europe Ltd.