


Bitcoin Analysis: BTC Weakness Deepens as Price Approaches $70K
These continue to be challenging sessions for Bitcoin in the short term. The cryptocurrency keeps losing ground consistently and has declined nearly 2.7% over the last three trading sessions, highlighting a phase of weakness that is becoming increasingly relevant within the market.
Share this:

These continue to be challenging sessions for Bitcoin in the short term. The cryptocurrency keeps losing ground consistently and has declined nearly 2.7% over the last three trading sessions, highlighting a phase of weakness that is becoming increasingly relevant within the market.
Part of the recent selling pressure stems from the deterioration in confidence that began after the U.S. legislative elections and has now been reinforced by economic data pointing toward a potentially more aggressive Federal Reserve in the months ahead. Bitcoin continues to show a high degree of sensitivity to this type of event due to its behavior as a risk asset, and as long as this backdrop of uncertainty remains in place, selling pressure could continue to play an important role in the coming sessions.

Is Uncertainty Around Demand Increasing?
One of the most important developments in recent sessions was the outcome of the U.S. legislative elections. The Democratic Party's victory revived concerns regarding the future of several cryptocurrency-friendly regulatory initiatives, including proposals such as the Clarity Act, a project largely supported by the Trump administration that could now face greater difficulties under the new legislative balance of power.
Bitcoin had already begun to show some sensitivity to this political backdrop during the previous week. However, what has now regained prominence is the possibility of a more aggressive Federal Reserve.
Strong NFP data released at the end of last week were followed today by CPI m/m and Core CPI m/m inflation figures, both of which came in above market expectations. Core CPI rose by 0.3% versus 0.2% expected, while CPI reached 0.4% compared with the 0.3% forecast.
The combination of a resilient labor market and inflationary pressures that continue to show persistence has reinforced the perception that the Federal Reserve could maintain a relatively more aggressive stance over the coming months.
This scenario is not particularly supportive for Bitcoin because a higher-rate environment tends to reduce liquidity available for risk assets while increasing the appeal of alternative markets such as bonds and the U.S. dollar.
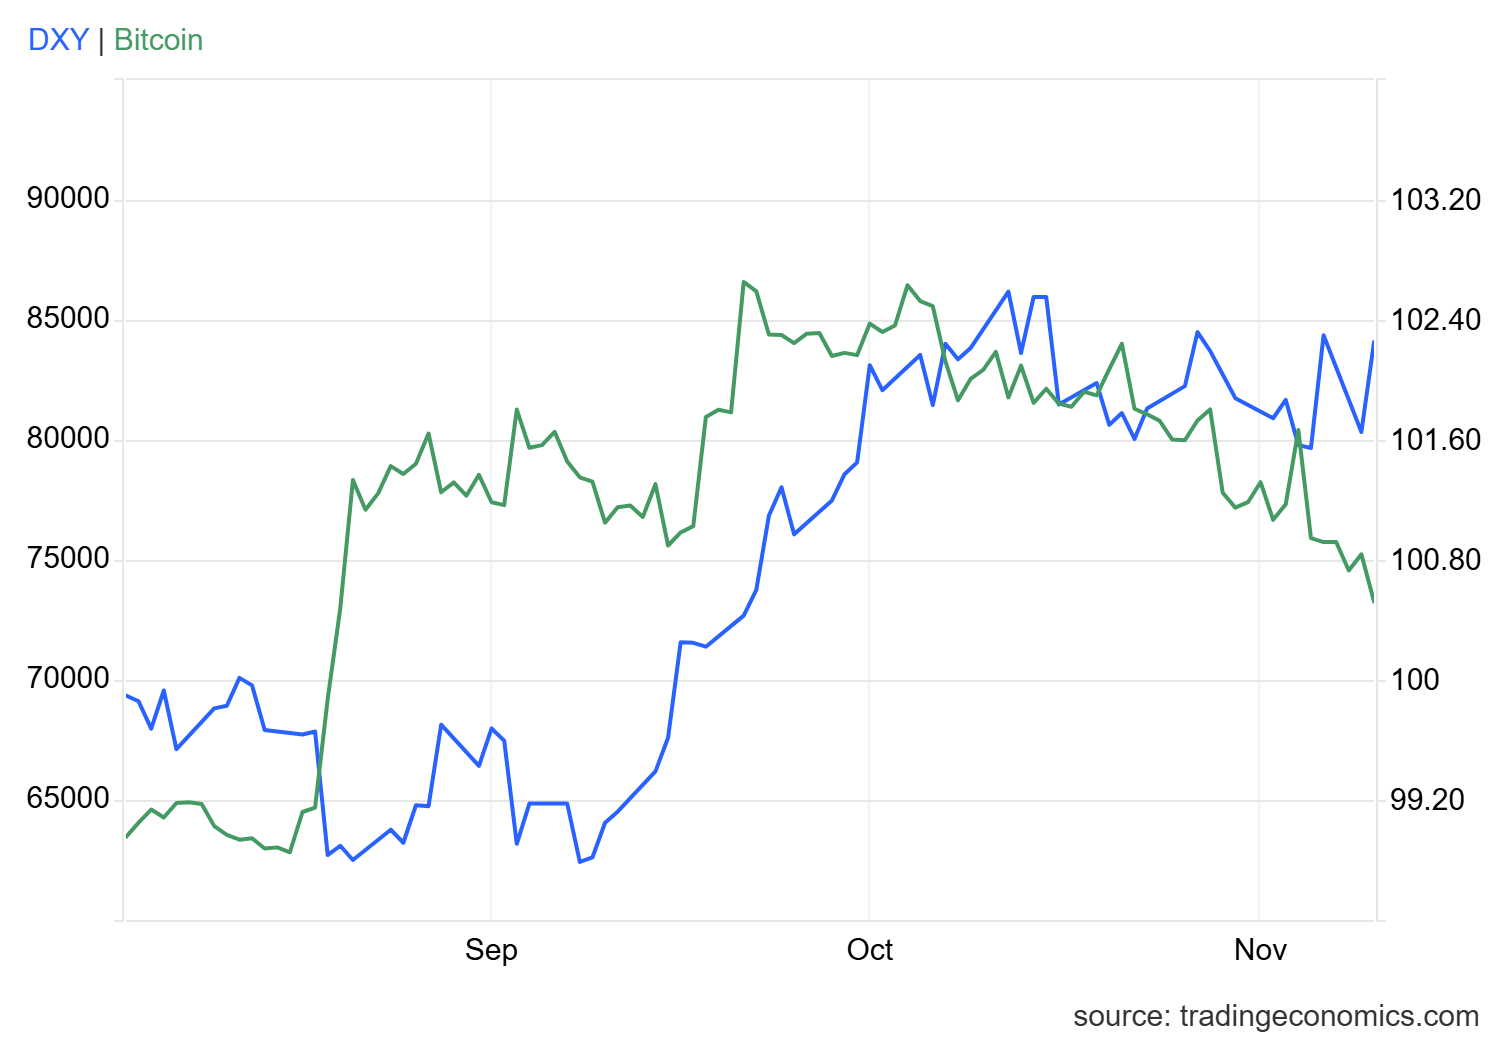
Part of this dynamic can already be observed in the bond market. Expectations for higher rates have helped push 10-year Treasury yields back toward the 5.00% area. At the same time, the DXY, which measures the strength of the U.S. dollar against its main peers, continues to trade above the 102-point area and remains close to its yearly highs.
Meanwhile, Bitcoin continues to move in the opposite direction, suggesting that part of the demand is shifting toward markets that are currently perceived as relatively more attractive. As a result, the weakness that began to emerge after the elections continues to find new factors supporting it.
Source: TradingEconomics
Another important aspect to consider is that this combination of political and economic developments has been accompanied by a persistent slowdown in demand across the Bitcoin market.
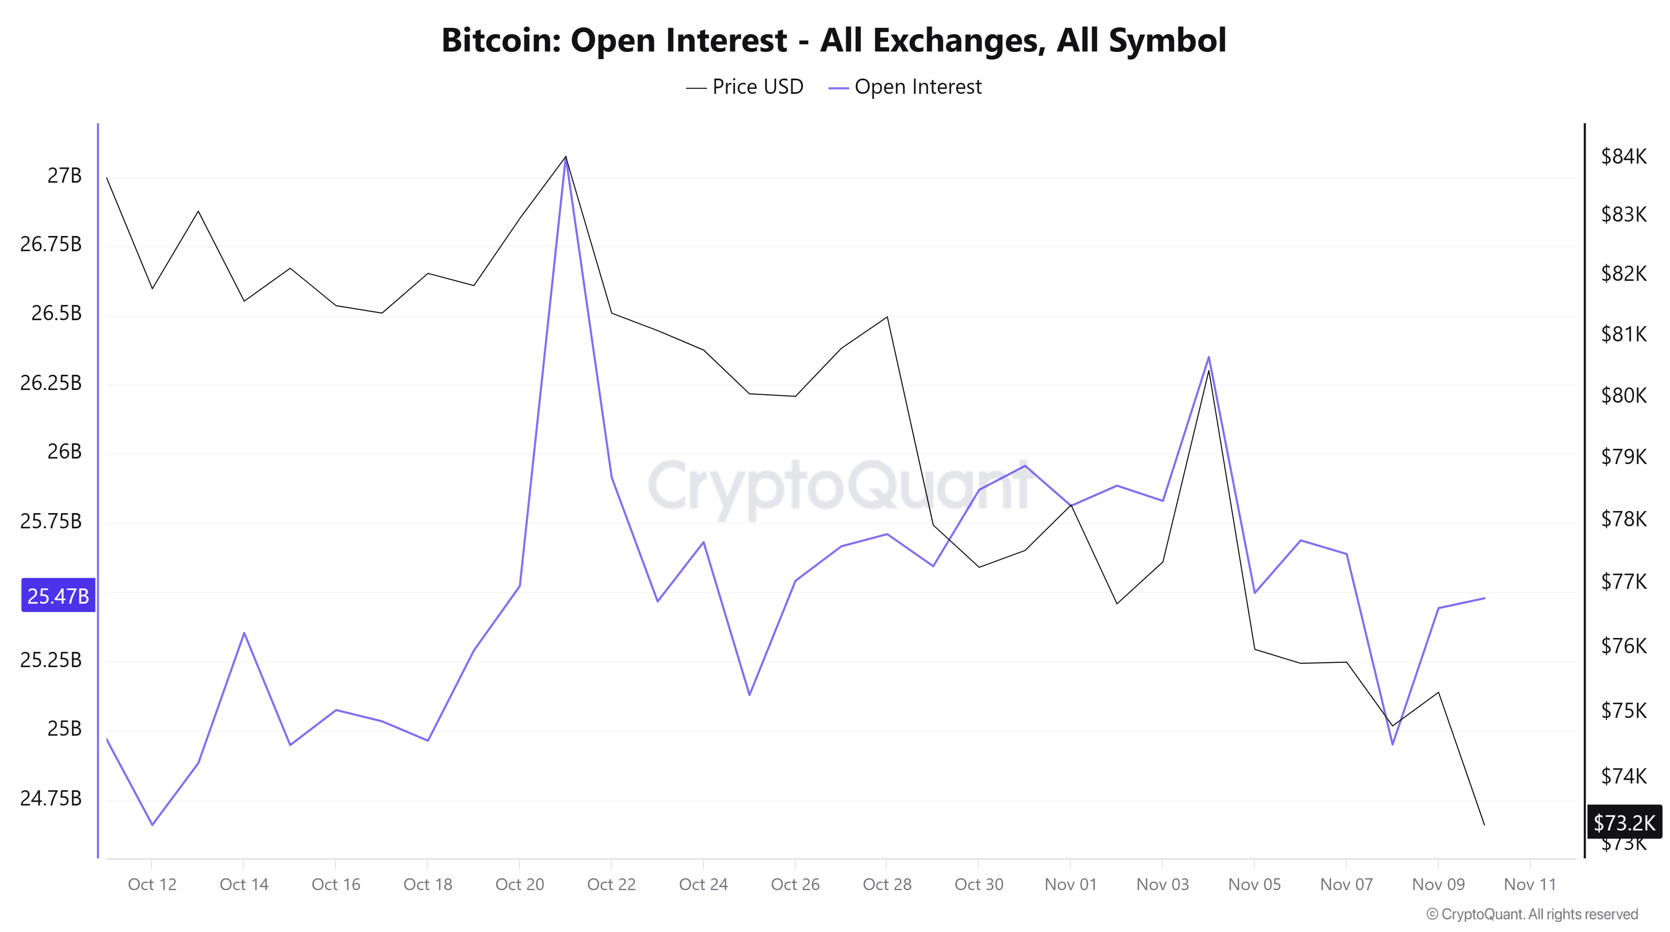
This can be observed through the behavior of Open Interest, an indicator that measures the total number of open positions across the market. Since the beginning of the month, Open Interest has continued trending lower and remains near $25.4 billion, showing no meaningful signs of recovery.
This dynamic is particularly important because a simultaneous decline in both price and Open Interest often reflects a gradual reduction in long positioning. In other words, demand continues to weaken, suggesting that Bitcoin is struggling to establish itself either as an attractive risk asset or as a meaningful safe-haven alternative under current market conditions.
Source: Cryptoquant
With all of this in mind, Bitcoin's weakness has become increasingly relevant as markets once again consider the possibility of a relatively more aggressive Federal Reserve. As long as expectations of higher interest rates remain a dominant theme, selling pressure could continue to be an important characteristic of Bitcoin's price action over the coming sessions.
Bitcoin Technical Forecast
Source: StoneX, Tradingview
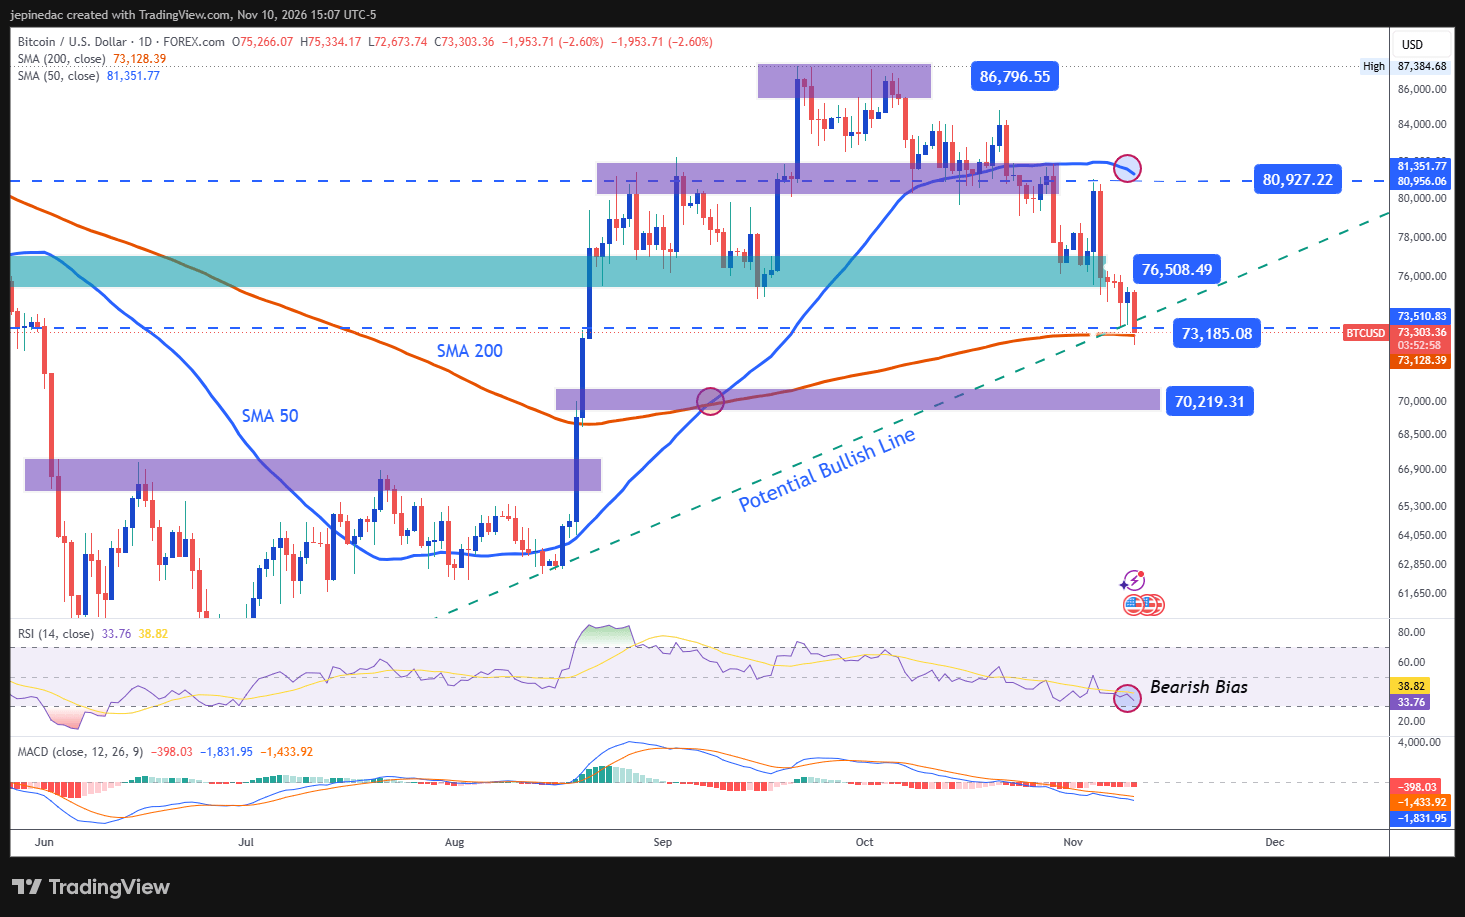
- The bullish trend enters a risk zone: For several months, Bitcoin has maintained an important long-term bullish trendline that continues to represent the dominant technical structure on the daily chart. However, recent sessions have seen the emergence of a more consistent wave of selling pressure that is pushing price toward increasingly important support levels. If this dynamic remains intact and new lows begin to develop, the risk of a breakdown of the dominant bullish structure could increase, potentially opening the door to a more relevant bearish phase over the coming weeks.
- RSI: The RSI remains below the 50 neutral level, reflecting that sellers continue to dominate recent market momentum. As long as this reading remains in place, the bearish bias could continue to be an important feature of Bitcoin's price action.
- MACD: A similar picture can be observed in the MACD, whose histogram remains below the 0 neutral line. This reading reflects persistent bearish momentum within short-term moving averages and continues to support the growing relevance of selling pressure.
Key Levels:
- $76,500 – Key Resistance: A retracement area observed several weeks ago that now represents the main upside barrier on the chart. Price action returning toward this level could restore relevance to the bullish bias and help preserve the longer-term bullish structure.
- $73,200 – Near-Term Barrier: A level that coincides with the 200-period simple moving average and currently represents one of the most important technical references on the chart. This area could act either as a key support level or as the point where the long-term bullish trend finally breaks.
- $70,000 – Critical Support: A major psychological level that represents the most important downside reference in the short term. Price action moving consistently toward this area would not only increase the risk of a complete breakdown of the long-term bullish trend but could also open the door to a more dominant bearish structure in the weeks ahead.
Written by Julian Pineda, CFA, CMT – Market Analyst
Follow him on: @julianpineda25
Latest market news




The complete CFD trading experience
Award-winning platforms, competitive spreads, low commissions and dedicated support.
We live and breathe the markets and are dedicated to helping traders realise their ambitions as we continue to set the industry bar.
Economic calendar
Web Trader platform
Our sophisticated web-based platform is packed with features.
Related articles
Bitcoin Analysis: BTC Weakness Deepens as Price Approaches $70K
These continue to be challenging sessions for Bitcoin in the short term. The cryptocurrency keeps losing ground consistently and has declined nearly 2.7% over the last three trading sessions, highlighting a phase of weakness that is becoming increasingly relevant within the market.
US Dollar Technical Forecast: DXY Bulls Target Yearly Highs After Hot CPI 11 10 2026
The Dollar is attempting a third straight weekly gain, but bearish momentum divergence warns the recovery may be vulnerable at major resistance.

EUR/USD Analysis: U.S. Inflation Data Keeps Pressure on the Euro
The trading week continues to unfold and the latest session has once again highlighted weakness around the euro against the U.S. dollar. EUR/USD is down nearly 0.3%, reflecting that the European currency continues to struggle to sustain a consistent recovery in the short term.
StoneX Europe Ltd may make third party material available on this website which may contain information included but not limited to the conditions of financial markets. The material is for information purposes only and does not contain, and should not be construed as containing, investment advice and/or investment recommendation and/or an investment research and/or an offer of or solicitation for any transactions in financial instruments; any decision to enter into a specific transaction shall be made by the client following an assessment by him/her of their situation.
StoneX Europe Ltd makes no representation or warranty and assumes no liability as to the accuracy or completeness of the information provided, nor any loss arising from any investment based on a recommendation, forecast or other information supplied. You should always seek independent advice as to your suitability to speculate in any related markets and your ability to assume the associated risks, if you are at all unsure. We are not under any obligation to update any such material. Any opinion made may be personal to the author and may not reflect the opinion of StoneX Europe Ltd.