




US defense stocks set to benefit from Middle East geopolitical tensions LMT LHX
Lockheed Martin and L3Harris Technologies may see further upside within their respective bullish technical configurations.
Share this:

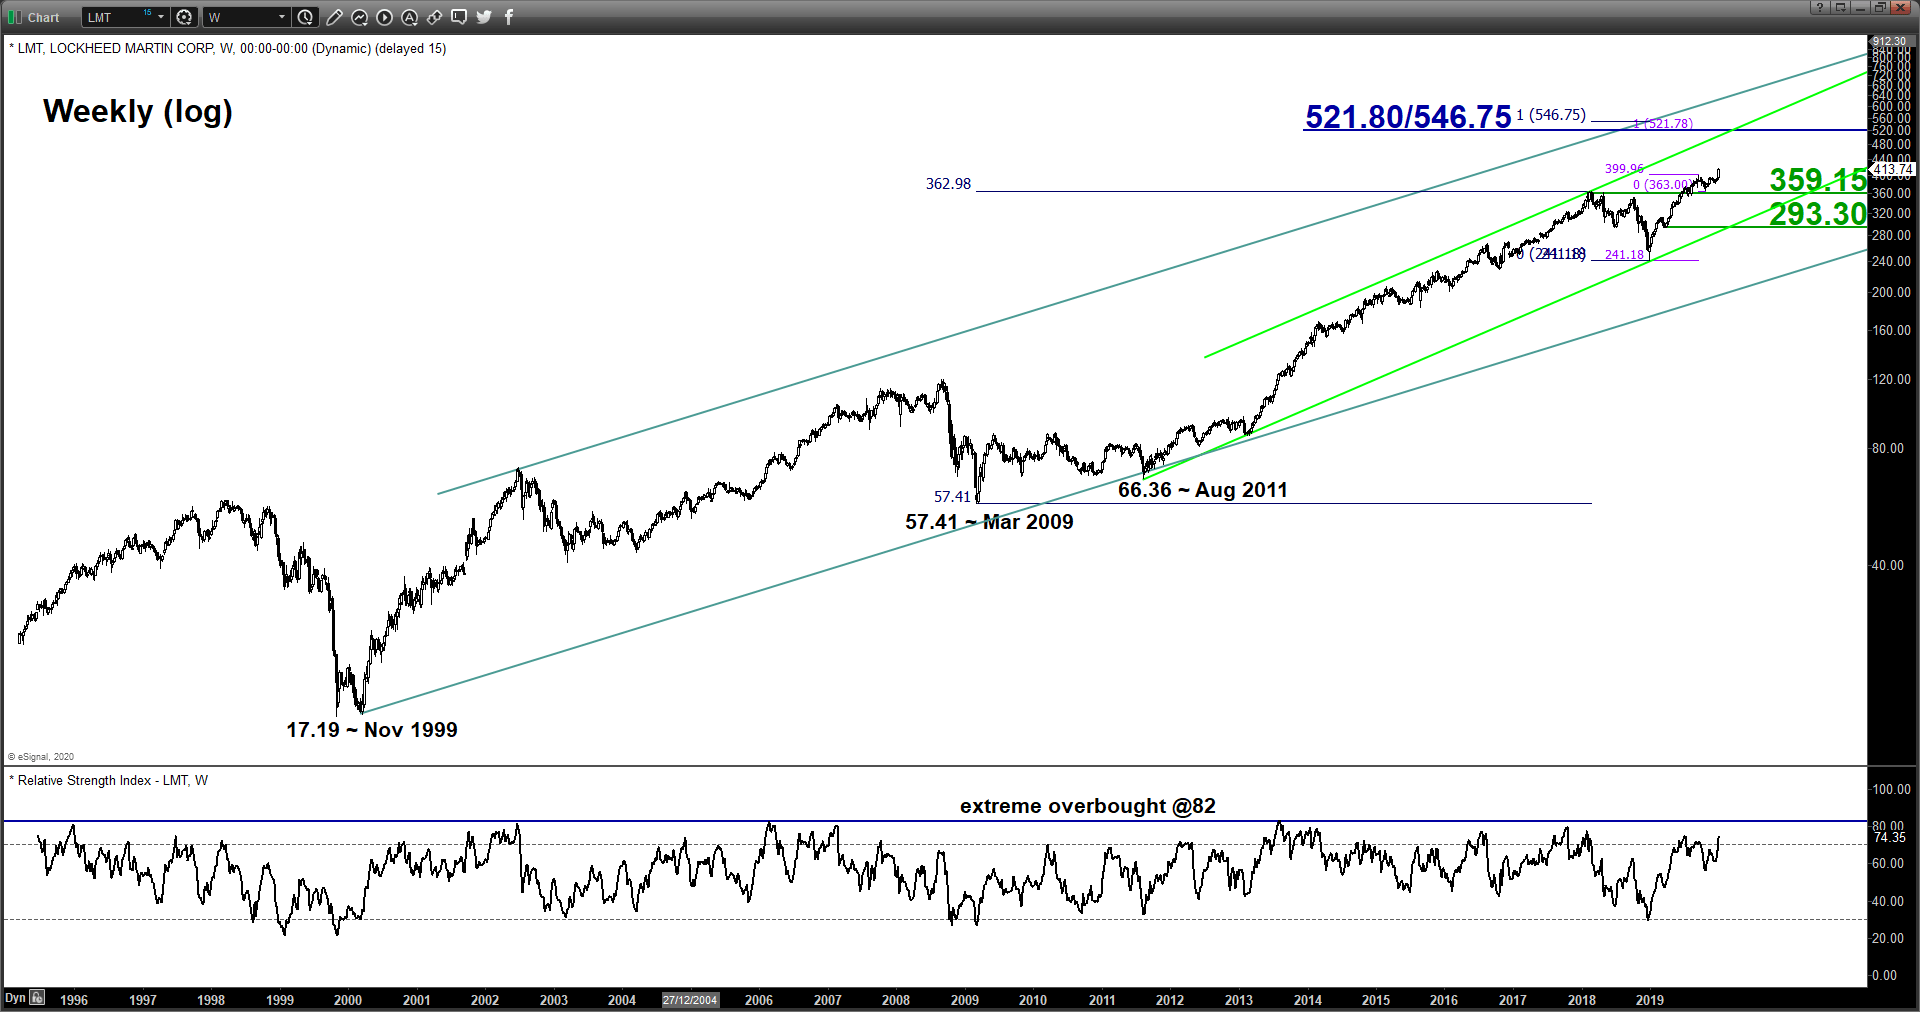
Lockheed Martin Corp (LMT) – Fresh all-time high, further potential upside ahead
click to enlarge charts
- LMT has staged a bullish breakout on last Fri, 03 Jan 2019 from a 3-month range configuration in place since 17 Sep 2019. Medium-term upside momentum remains intact as seen by the weekly & daily RSI oscillators.
- Relative strength analysis from its ratio (LMT/SPY) suggest outperformance of LMT against the S&P 500.
- Bullish bias in any dips above 393.90 for a further potential push up to target the next resistances at 461.10/465.90 and 484.30. On the other hand, a break with a daily close below 393.90 invalidates the bullish breakout for a choppy slide towards the next support at 359.15 (former swing high areas of 02 Feb/24 Apr 2018).
L3Harris Technologies Inc (LHX) – Eyeing a potential break above 271.31 current all-time high
click to enlarge chart
- Last Fri, 03 Jan 2019, the share price of LHX has staged a gapped up above the intermediate swing highs areas of 23/24 Dec 2018 and rallied by 3.70%.
- Elements are bullish with its price action that has continued to evolve within a major ascending channel in place since 26 Dec 2018. The upper boundary of the ascending channel stands at 248.30 which also confluences with the 0.618 Fibonacci expansion of the up move from 26 Dec 2018 low to 06 Sep 2019 high projected from 05 Nov 2019 low.
- Medium-term upside momentum of price action has resurfaced as indicated by the bullish breakout seen in the daily RSI oscillator from a corresponding significant descending resistance after a prior bullish divergence signal.
- Relative strength analysis from its ratio (LHX / SPY) has indicated that LHX has started to show outperformance against the S&P 500.
- Bullish bias in any dips above 192.10 medium-term pivotal support for a further potential push up to retest 217.31 current all-time high before targeting the next resistance at 248.30. On the other hand, a break with a daily close below 192.10 negates the bullish tone for a slide towards the next support at 170.55 (former swing range resistance from 24 Apr/16 Oct 2018).
Charts are from eSignal
Lockheed Martin Corp (LMT) – Fresh all-time high, further potential upside ahead
click to enlarge charts
- LMT has staged a bullish breakout on last Fri, 03 Jan 2019 from a 3-month range configuration in place since 17 Sep 2019. Medium-term upside momentum remains intact as seen by the weekly & daily RSI oscillators.
- Relative strength analysis from its ratio (LMT/SPY) suggest outperformance of LMT against the S&P 500.
- Bullish bias in any dips above 393.90 for a further potential push up to target the next resistances at 461.10/465.90 and 484.30. On the other hand, a break with a daily close below 393.90 invalidates the bullish breakout for a choppy slide towards the next support at 359.15 (former swing high areas of 02 Feb/24 Apr 2018).
click to enlarge chart
- Last Fri, 03 Jan 2019, the share price of LHX has staged a gapped up above the intermediate swing highs areas of 23/24 Dec 2018 and rallied by 3.70%.
- Elements are bullish with its price action that has continued to evolve within a major ascending channel in place since 26 Dec 2018. The upper boundary of the ascending channel stands at 248.30 which also confluences with the 0.618 Fibonacci expansion of the up move from 26 Dec 2018 low to 06 Sep 2019 high projected from 05 Nov 2019 low.
- Medium-term upside momentum of price action has resurfaced as indicated by the bullish breakout seen in the daily RSI oscillator from a corresponding significant descending resistance after a prior bullish divergence signal.
- Relative strength analysis from its ratio (LHX / SPY) has indicated that LHX has started to show outperformance against the S&P 500.
- Bullish bias in any dips above 192.10 medium-term pivotal support for a further potential push up to retest 217.31 current all-time high before targeting the next resistance at 248.30. On the other hand, a break with a daily close below 192.10 negates the bullish tone for a slide towards the next support at 170.55 (former swing range resistance from 24 Apr/16 Oct 2018).
Charts are from eSignal
Related tags:




The complete CFD trading experience
Award-winning platforms, competitive spreads, low commissions and dedicated support.
We live and breathe the markets and are dedicated to helping traders realise their ambitions as we continue to set the industry bar.
Economic calendar
Web Trader platform
Our sophisticated web-based platform is packed with features.
Related articles

Crude Oil Forecast WTI Prices Come Under Pressure as Middle East Risks Ease
Over the last two trading sessions, WTI crude oil has once again displayed a notable bearish bias, with prices falling nearly 6%. Part of this renewed selling pressure has been driven by recent developments in the Middle East, which have helped temporarily ease the geopolitical tensions that had supported the oil risk premium in previous weeks.


Crude oil analysis: WTI path of least resistance to upside
Crude oil prices continue to press higher amid the ongoing standoff between the US and Iran. While the softness in US and Chinese data of late does point to some moderation in demand, oil prices remain predominately supply-driven.


EUR/USD outlook undermined by crude oil resurgence
Crude oil and bond markets are flashing warning signs for risk assets. Yet, investors seem remarkably relaxed. However, if the current situation doesn’t improve markedly, we could see stock markets stage a bit of a correction and in the FX space risk-sensitive currency pairs could take a dip.
StoneX Europe Ltd may make third party material available on this website which may contain information included but not limited to the conditions of financial markets. The material is for information purposes only and does not contain, and should not be construed as containing, investment advice and/or investment recommendation and/or an investment research and/or an offer of or solicitation for any transactions in financial instruments; any decision to enter into a specific transaction shall be made by the client following an assessment by him/her of their situation.
StoneX Europe Ltd makes no representation or warranty and assumes no liability as to the accuracy or completeness of the information provided, nor any loss arising from any investment based on a recommendation, forecast or other information supplied. You should always seek independent advice as to your suitability to speculate in any related markets and your ability to assume the associated risks, if you are at all unsure. We are not under any obligation to update any such material. Any opinion made may be personal to the author and may not reflect the opinion of StoneX Europe Ltd.