



Crude oil analysis: WTI path of least resistance to upside
Crude oil prices continue to press higher amid the ongoing standoff between the US and Iran. While the softness in US and Chinese data of late does point to some moderation in demand, oil prices remain predominately supply-driven.
Share this:

The price of oil is pushing higher again as you would expect with the current situation. In this crude oil analysis, I will highlight the key factors pushing prices and levels to watch on WTI.
Crude oil analysis: Can’t see how prices can fall given current situation
Crude oil prices continue to press higher amid the ongoing standoff between the US and Iran. While the softness in US and Chinese data of late does point to some moderation in demand, oil prices remain predominately supply-driven. Crude oil is largely demand inelastic anyway, meaning buying stays strong when prices go up and down. Demand only gets destructed when prices go up by significant amounts and stay elevated. I am not sure the current prices of around $85-$95 fits that bill. Unless the strait of Hormuz re-opens, I just can’t see how oil prices will fall back meaningfully in the near-term.
Technical crude oil analysis: WTI levels to watch
The trend is certainly bullish on oil prices right now, regardless of the timeframe. The hourly chart here shows a bullish trend line connecting the recent lows. Shallow dips, followed by short periods of consolidation and then the inevitable break to the upside. Resistance after resistance levels have broken. Today it was the $85 level that had offered some resistance, but at the time of writing, WTI was starting to climb above this level too. Let’s see if it will soon run into some offers. Even so, the downside should be limited given the macro backdrop.
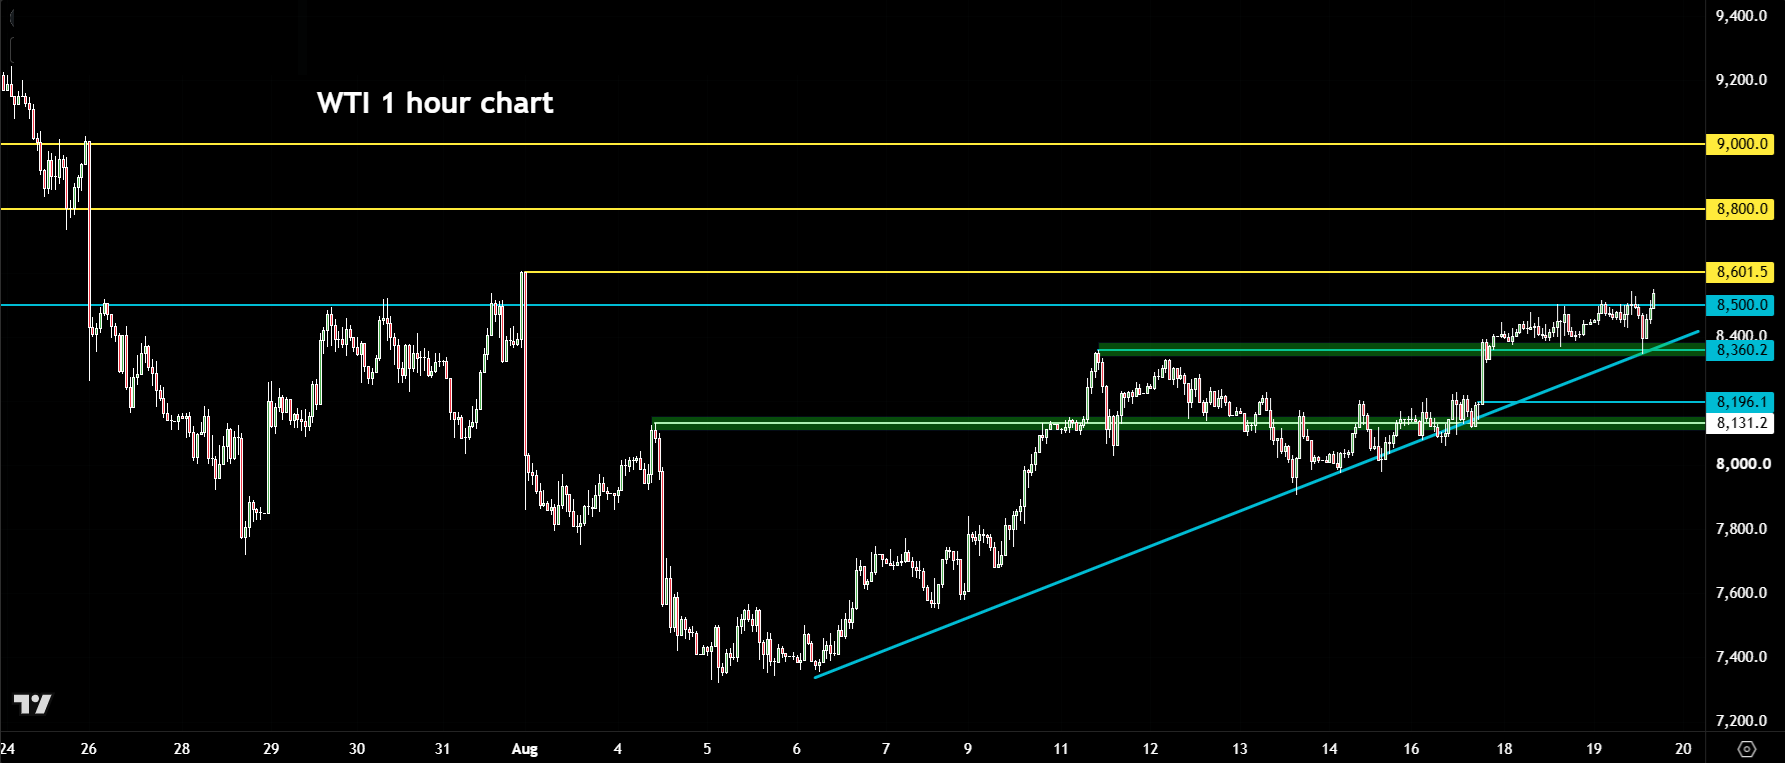
Anyway, support below $85.00 sits around $84.00 and then $83.60 on the oil price chart. If the latter breaks then we could see a potential dip to near the point of origin of this week’s breakout around $82.00 area.
On the upside, the next potential target is the liquidity above the 31st July high of $86.00, followed by the next round handles of $87.00 and $88.00, before the focus turns to the next psychological level of $90.00.
-- Written by Fawad Razaqzada, Market Analyst
Follow Fawad on Twitter @Trader_F_R
Related tags:
Latest market news



The complete CFD trading experience
Award-winning platforms, competitive spreads, low commissions and dedicated support.
We live and breathe the markets and are dedicated to helping traders realise their ambitions as we continue to set the industry bar.
Economic calendar
Web Trader platform
Our sophisticated web-based platform is packed with features.
Related articles
Nasdaq 100 Forecast: NDX rebounds as oil prices fall and ahead of Apple earnings
U.S. stock indices are moving higher on Monday as tech and AI-related stocks steady following a shocking October. The mood remains cautious following the AI wobble, with more tech earnings due this week, U.S. midterm elections and a full U.S. economic data calendar.


Crude Oil Weekly Outlook: U.S.–Iran Deal Hopes Ahead of Elections?
Crude oil weekly outlook: U.S.–Iran negotiations may be moving closer to a breakthrough as the U.S. midterm elections approach on Tuesday, bringing key resistance levels on crude oil charts into focus.


StoneX Europe Ltd may make third party material available on this website which may contain information included but not limited to the conditions of financial markets. The material is for information purposes only and does not contain, and should not be construed as containing, investment advice and/or investment recommendation and/or an investment research and/or an offer of or solicitation for any transactions in financial instruments; any decision to enter into a specific transaction shall be made by the client following an assessment by him/her of their situation.
StoneX Europe Ltd makes no representation or warranty and assumes no liability as to the accuracy or completeness of the information provided, nor any loss arising from any investment based on a recommendation, forecast or other information supplied. You should always seek independent advice as to your suitability to speculate in any related markets and your ability to assume the associated risks, if you are at all unsure. We are not under any obligation to update any such material. Any opinion made may be personal to the author and may not reflect the opinion of StoneX Europe Ltd.