



US dollar forecast: is NZD/USD ready to form a bottom near its 2020 low?
NZD/USD is testing the 0.5450 to 0.5500 zone that marked its 2020 COVID low. With a hawkish Fed, weaker metals and risk aversion weighing on the Kiwi, is a bottom forming, and what would confirm it?
Share this:
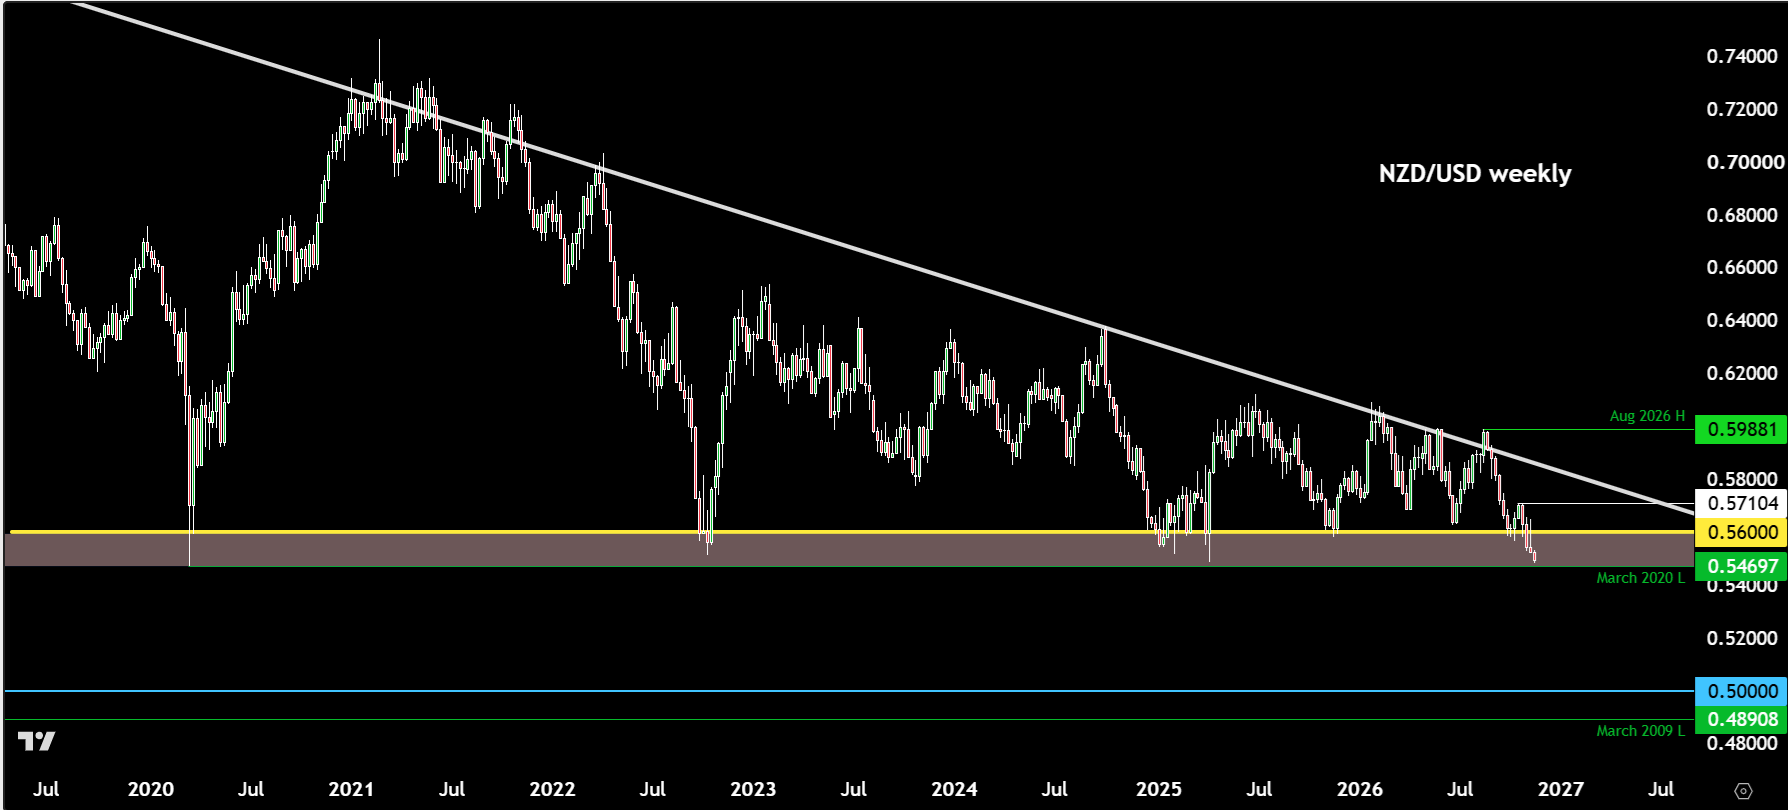
The NZD/USD is testing a major long-term support zone that marked its 2020 COVID-crisis low, and although there are no clear signs yet that the Kiwi may have carved out a bottom, I am nevertheless on the lookout for one. The pair fell for six consecutive sessions as of yesterday on a hawkish repricing of Fed expectations and weaker risk appetite, while softer industrial metals have added another headwind. The near-term NZD/USD forecast hangs in the balance until price confirms a low.
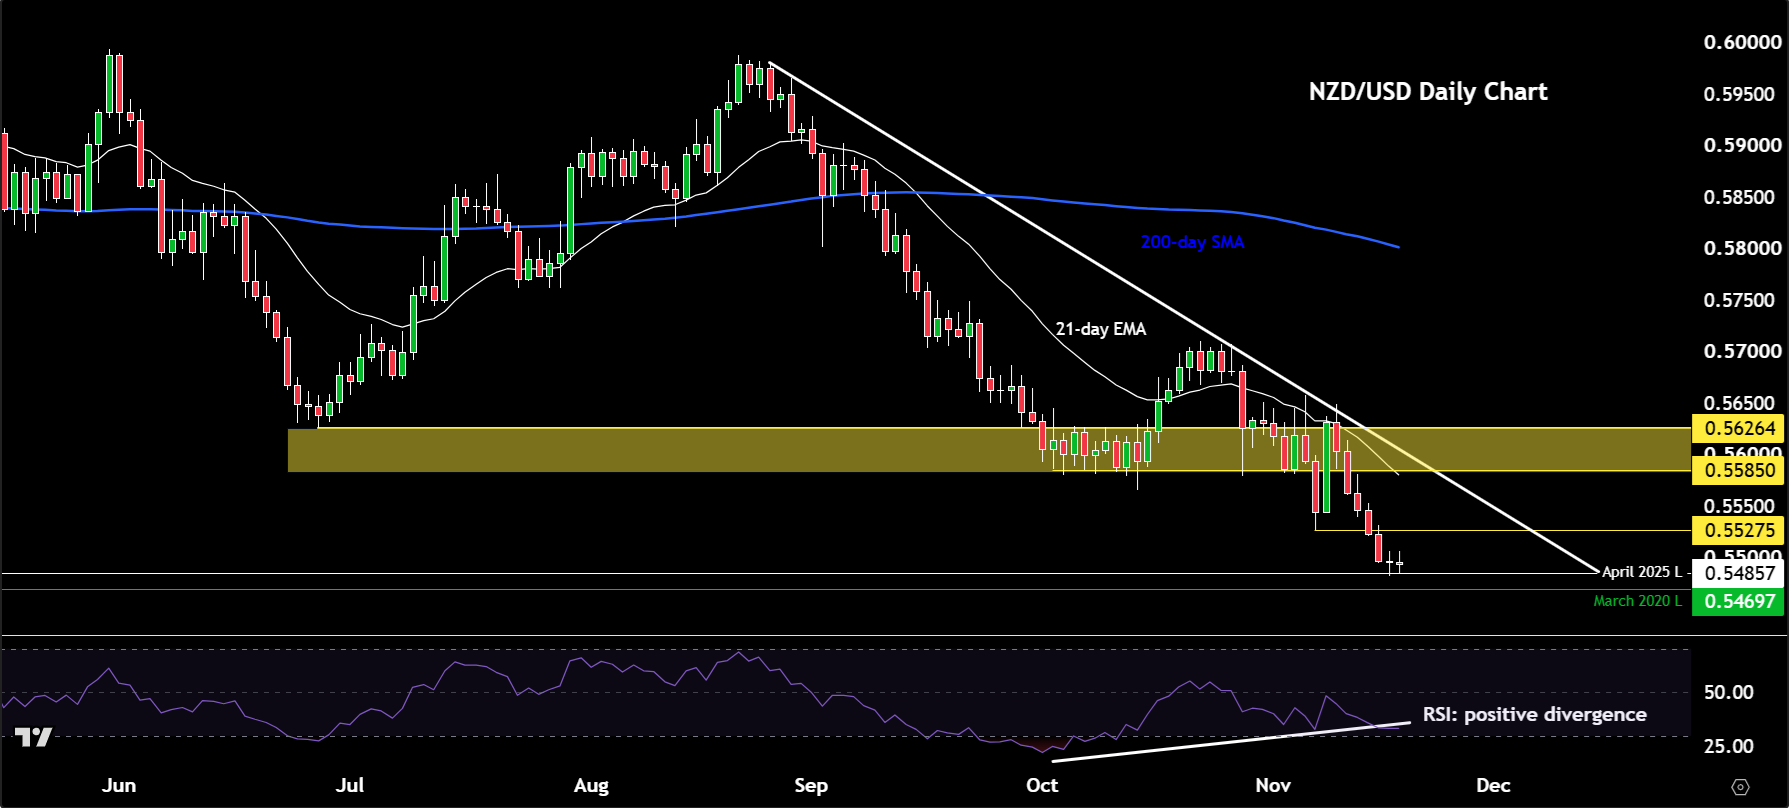
- NZD/USD is back at the zone of its 2020 low, printing a doji candle alongside a bullish RSI divergence on the daily chart
- Hot US inflation, a near-certain December Fed hike, risk aversion and weaker industrial metals continue to weigh on ComDolls
- A weekly move back above the 0.5710 area would be the trigger for a more meaningful recovery
Watch the Full Video
Before discussing the macro factors weighing on the New Zealand dollar, let's have a quick look at the chart first.
Technical NZD/USD forecast and key levels to watch
From a technical analysis point of view, the NZD/USD has arrived at a historically important area of support, near 0.5450 to 0.5500. As can be observed on the weekly chart, this is where the pair formed a major low in 2020 at the height of the COVID crisis, before retesting it a couple of years later and several times in 2025, most recently in April.
After slumping into this zone over the past several days, the pair formed a small doji candle on the daily chart yesterday, while the RSI has made higher lows relative to its October low even as price made lower lows. If this holds, a false breakout and a double bottom could be on the cards. Confirmation is still needed, however, and for me a weekly move back above the 0.5710 area, the most recent local high, would be the bullish trigger.
Whether that trigger is reached will depend largely on the US dollar.
Hawkish Fed expectations keep the dollar in the driving seat
The US dollar remains the dominant influence on NZD/USD, and it continues to go from strength to strength. The Dollar Index has climbed to a 19-month high, extending a rally fuelled by signs that US inflationary pressures are proving stubborn.
Comments from the Fed's Christopher Waller last Tuesday brought the prospect of a prolonged tightening cycle into sharper focus. Since then, US inflation data have surprised to the upside, with October's CPI rising 0.4% month on month, while economic activity has remained resilient. Markets are now pricing in roughly a 95% probability of a 25-basis-point hike at the 9 December FOMC meeting, and this evening's FOMC meeting minutes will offer further insight into the Fed's view of the US economy and interest rates.
For the Kiwi, the problem is therefore twofold. A stronger dollar is putting direct pressure on the pair, while the prospect of higher US interest rates makes lower-yielding currencies less attractive. Unless incoming US data begin to challenge that hawkish reassessment, the greenback could retain its near-term advantage, even if the rally is starting to look stretched.
RBNZ inflation expectations offer limited support
For the New Zealand dollar, one of the more important data releases was the Reserve Bank of New Zealand's fourth-quarter Survey of Expectations, which was published on Tuesday. This showed one-year inflation expectations rising to 2.92% from 2.60%. The more closely watched two-year measure edged up only marginally, to 2.36% from 2.34%.
That mixed picture hardly makes a compelling case for a more aggressive tightening cycle. The RBNZ left its Official Cash Rate unchanged at 2.75% on 28 October after a closely divided 4-3 vote. Ultimately, it is the interest-rate differential between the two economies that matters for NZD/USD, and for now it appears to favour the dollar.
Risk aversion and weaker metals add to the Kiwi's woes
There is also a broader risk-aversion element to the Kiwi's weakness. The Nasdaq's recent correction, driven by worries over AI valuations and spending, has unsettled investors without denting expectations for a more hawkish Fed. As a risk-sensitive currency, the Kiwi tends to suffer when investors turn defensive, while the dollar typically benefits.
Weakness in industrial metals is adding to the pressure. Iron ore has come under renewed selling and copper is beginning to roll over. Sustained weakness in metals typically weighs on commodity currencies such as the Australian dollar and South African rand and, to a lesser extent, the Kiwi.
Still, tech stocks could find some near-term support from Nvidia's strong third-quarter earnings last night and today's Anthropic IPO, expected to price towards the top of its $70–78 range. With much of the hawkish repricing possibly behind us, a pullback in a stretched dollar could give the Kiwi room to recover from a level that has held repeatedly in the past.
Frequently asked questions
Why is NZD/USD falling?
Hotter-than-expected US inflation has reinforced bets on further Fed tightening, while a correction in technology stocks and weaker industrial metals have dented risk appetite. Together, they pushed the pair lower for six consecutive sessions.
What did the RBNZ's latest survey show?
One-year inflation expectations rose to 2.92%, but the two-year measure barely moved and five-year expectations fell, offering little reason to expect more aggressive RBNZ tightening.
What would confirm a bottom in NZD/USD?
A weekly move back above the 0.5710 area, the most recent local high, would be the bullish trigger, turning the current test of the 2020 low into a potential double bottom.
-- Written by Fawad Razaqzada, Market Analyst | Follow Fawad on Twitter @Trader_F_R
Related tags:
Latest market news




The complete CFD trading experience
Award-winning platforms, competitive spreads, low commissions and dedicated support.
We live and breathe the markets and are dedicated to helping traders realise their ambitions as we continue to set the industry bar.
Economic calendar
Web Trader platform
Our sophisticated web-based platform is packed with features.
Related articles
USD/JPY Outlook: Yen Strength Builds as Carry Trades Come Under Threat
Rising equity volatility threatens yen carry trades as USD/JPY struggles at 160 resistance and AUD/JPY leads a broader recovery in the Japanese yen.
Gold and Silver's Deepening Dollar Dilemma
The dollar has broken higher, gold and silver have been crushed, and US financial conditions are tightening rapidly. Our historical analysis suggests this is no ordinary precious metals selloff.

British Pound Short-term Outlook: GBP/USD 3% Plunge Hits 12-Month Low—Key Support in Focus 11 19 2026
Sterling’s October rebound has unraveled, leaving GBP/USD bears in control—but stretched momentum raises the stakes for the weekly close

StoneX Europe Ltd may make third party material available on this website which may contain information included but not limited to the conditions of financial markets. The material is for information purposes only and does not contain, and should not be construed as containing, investment advice and/or investment recommendation and/or an investment research and/or an offer of or solicitation for any transactions in financial instruments; any decision to enter into a specific transaction shall be made by the client following an assessment by him/her of their situation.
StoneX Europe Ltd makes no representation or warranty and assumes no liability as to the accuracy or completeness of the information provided, nor any loss arising from any investment based on a recommendation, forecast or other information supplied. You should always seek independent advice as to your suitability to speculate in any related markets and your ability to assume the associated risks, if you are at all unsure. We are not under any obligation to update any such material. Any opinion made may be personal to the author and may not reflect the opinion of StoneX Europe Ltd.