





US Dollar Price Action Setups: EUR/USD, GBP/USD, USD/JPY, USD/CAD
The US Dollar finished its strongest month in three years and then followed it with the largest single-day sell-off in more than three months. The question now is which trend will take over?
Share this:

US Dollar Talking Points:
- The US Dollar finished July as its strongest month in more than three years. And then followed that up with the largest single-day sell-off in more than three months.
- At the source of that move on Friday was the NFP report that saw massive revisions to the prior two months’ data. But – the unemployment rate remained at the 4.2% expectation and that’s near full employment, begging the question as to whether the Fed will be motivated to cut rates in September.
- Markets are now pricing in a rate cut in September as well the possibility of two more by the end of the year despite the continued rise in inflation.
- In the webinar, I looked at the matter from both sides, looking for USD-strength setups in EUR/USD and possibly USD/CAD and USD-weakness in GBP/USD. USD/JPY remains of interest as there’s large macro implications, but EUR/JPY and GBP/JPY may present more attractive backdrops on either side of the Yen, at the moment.
The July rally in the USD wasn’t a straight line-higher, but it was the waning power from sellers that led to a breakout from a falling wedge pattern and the strongest monthly outing for the greenback since April of 2022.
That formation initially gave way after the release of CPI showed inflation continuing to gain in the US. That was on a Tuesday and I hosted a webinar that day, saying later in that session that I expected Trump to threaten to fire Jerome Powell. That happened less than 24 hours later and in-turn, the Dollar pulled back and continued to pullback for a bout a week after.
But sellers dried up around the 97.00 level, leading to a higher-low.
And then a strong rally developed in the USD with another breakout around the FOMC meeting last week, with DXY eventually going up to test last Q3’s lows at 100.22. This drive largely emanated from the fact that the Fed didn’t seem in a hurry to cut rates, with Powell saying that inflation continuing to move up with the labor market looking to be near full employment weren’t factors demanding for a rate cut.
But last Friday was another surprise as a massive revision to NFP for the prior two months brought with it question of the comments from Powell just a couple of days prior, and USD snapped back aggressively as markets built-in the expectation for more rate cuts this year, starting in September.
But the true test of trend is what happens in the counter-trend backdrops – whether sellers can drive to fresh lows or whether they stall and allow for bulls to come in and bring a higher-low. This brings focus to a big spot on the chart around the 98-handle in DXY.
US Dollar Daily Price Chart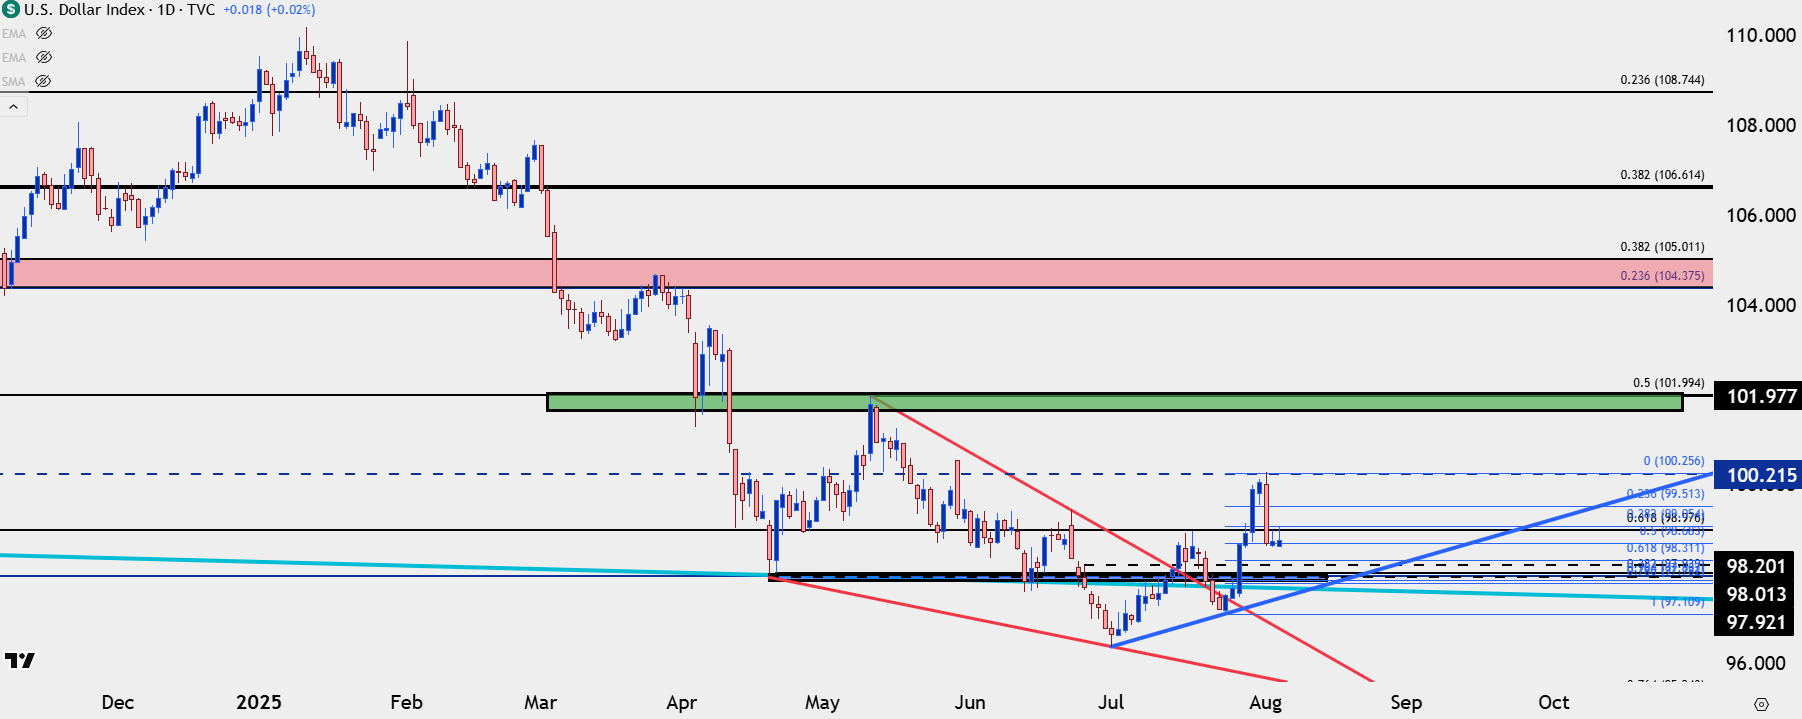
Chart prepared by James Stanley; data derived from Tradingview
USD Shorter-Term
At this point the US Dollar has erased 50% of the rally that had built into and around the FOMC meeting. There’s been a hold of short-term resistance at the 38.2% Fibonacci retracement of that move and the question now is whether bears can push down to fresh lower-lows, and if so, that highlights supports at 98.31 or 98.20, with a key support area around that 98-handle.
US Dollar Four-Hour Price Chart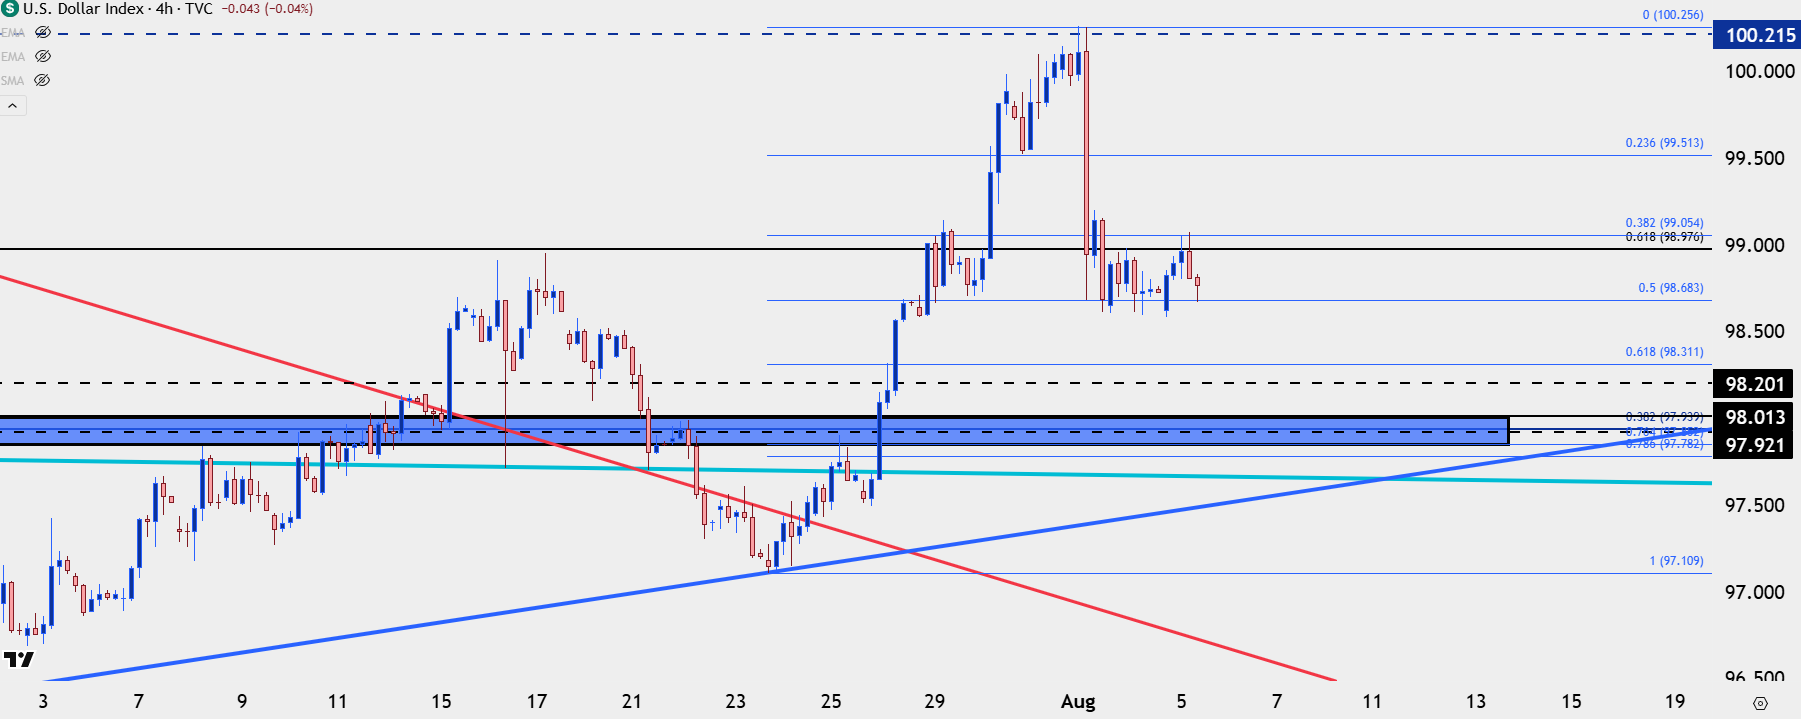
Chart prepared by James Stanley; data derived from Tradingview
EUR/USD
EUR/USD remains at a big spot on the chart and these are both zones that I had looked at ahead of the FOMC meeting last week.
The pair quickly went into oversold territory and that continued the July reversal setup after EUR/USD fell out of the bottom of a rising wedge pattern.
But the Friday pullback was rather extreme as price quickly jumped into the 1.1560-1.1593 zone, and that zone remains in-play a couple of days later. Support has held at the 1.1524-1.1543 zone and as looked at in the webinar, this can be justified from a couple of vantage points. From the daily chart, it looks like price is working on a lower-high at that key zone, and there’s deeper resistance potential at 1.1632 and 1.1663, after which 1.1686 comes into play.
From shorter-terms, it’s the hold of a higher-low after the Friday rally that stands out, and that exposes the 1.1500 level as vital for bulls to hold price above, with those deeper resistance levels noted above serving as bullish continuation targets.
EUR/USD Four-Hour Chart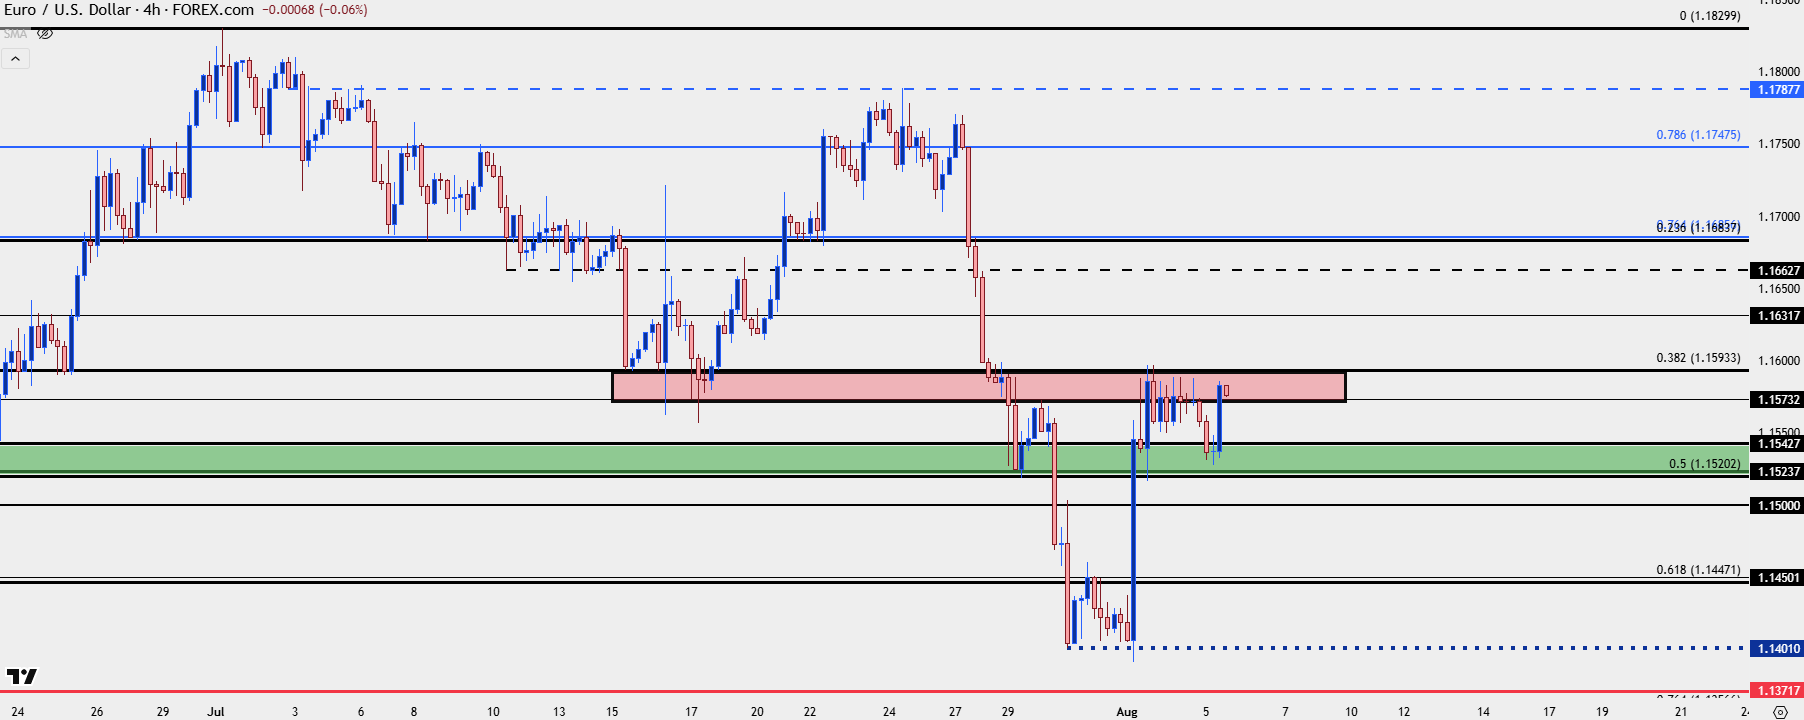
Chart prepared by James Stanley; data derived from Tradingview
GBP/USD
For USD-weakness I’m still partial towards Cable, with the 1.3145 level of resistance-turned-support so far having helped to set the low. In the webinar, I went over the shorter-term dynamics behind the pair along with what I wanted to see to keep the door open for bullish continuation. There’s now short-term support at 1.3253 followed by a zone from 1.3207-1.3234, and holds at either keep the door open for higher-lows and bullish continuation.
GBP/USD Daily Price Chart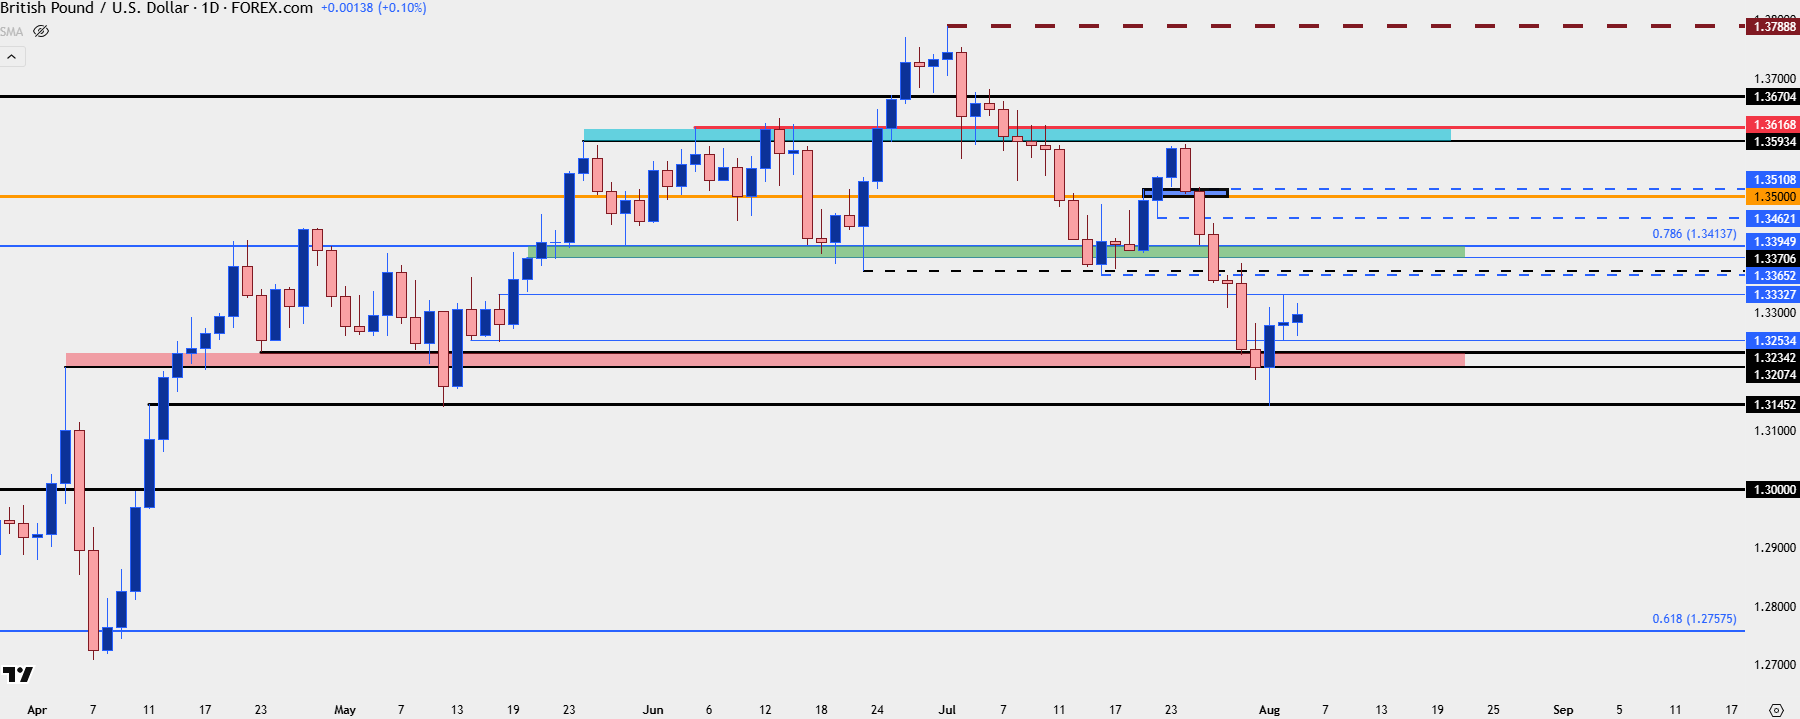
Chart prepared by James Stanley; data derived from Tradingview
USD/CAD
After showing as one of the more attractive pairs for USD-weakness in Q2, USD/CAD has been diverging from broader USD trends, of late. In July the pair has been working on higher-lows, and on the first day of Q3 trade even with USD plunging down to a fresh three-year low, USD/CAD remained above the prior low from June.
As a case in point of that relative difference, as USD tests the 50% mark of the recent rally as support, USD/CAD is testing the 38.2% Fibonacci retracement of its rally over the same span of time. Just below that there’s the prior resistance from the ascending triangle, around 1.3750.
USD/CAD Daily Price Chart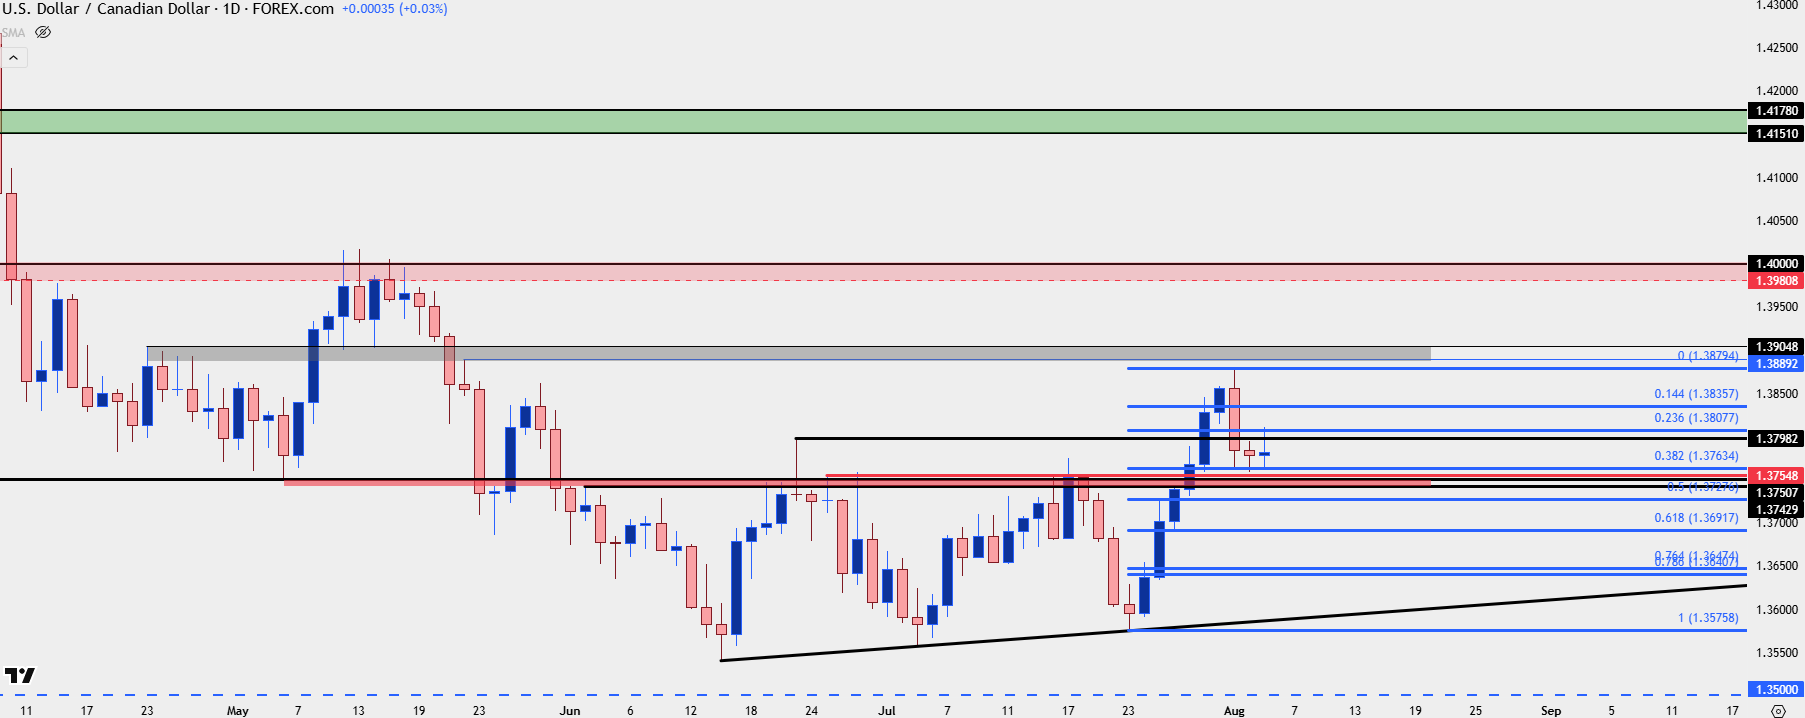
Chart prepared by James Stanley; data derived from Tradingview
USD/JPY
USD/JPY remains a hot button for larger macro themes and we saw this on full display last week with the Fed, BoJ and Core PCE, all leading into the massive sell-off after NFP on Friday. There’s also consideration of the long-term carry trade that remains in-place, and with building hopes for rate cuts, that can further press on the short side of the pair.
But, notably, with such a fast rise in rate cut hopes USD/JPY is still holding on to a higher-low at the Fibonacci level of 146.95. SO bulls aren’t completely out of it yet and like the USD setup looked at above, the big question is whether sellers can finally stretch down for a test of lower-lows.
For Yen-weakness, there may be more attractive backdrops elsewhere, such as EUR/JPY which is undergoing a support test at the 170-handle.
USD/JPY Daily Price Chart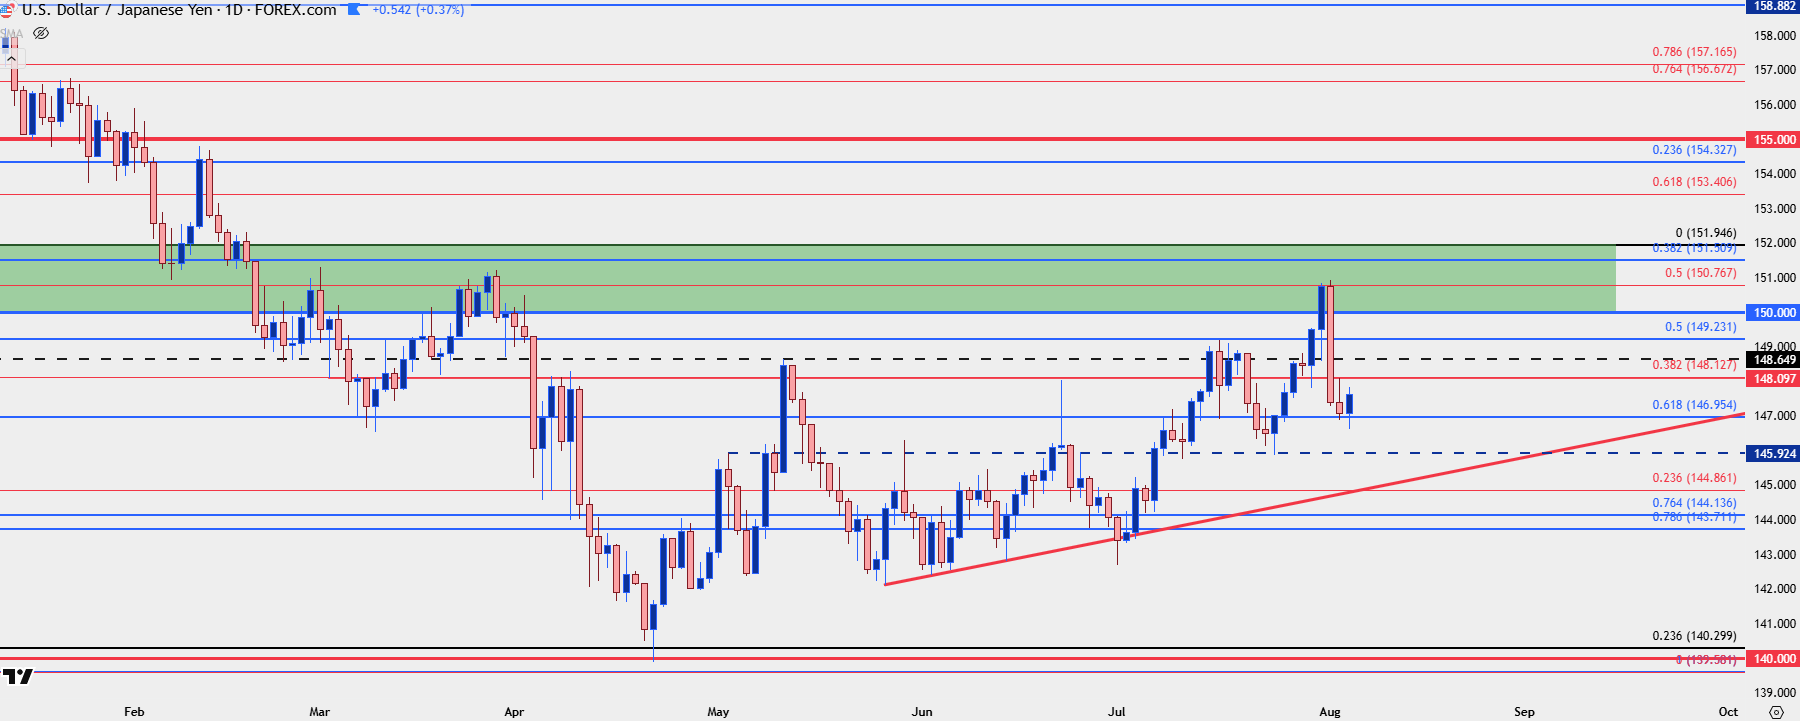
Chart prepared by James Stanley; data derived from Tradingview
--- written by James Stanley, Senior Strategist


The complete CFD trading experience
Award-winning platforms, competitive spreads, low commissions and dedicated support.
We live and breathe the markets and are dedicated to helping traders realise their ambitions as we continue to set the industry bar.
Economic calendar
Web Trader platform
Our sophisticated web-based platform is packed with features.
Related articles
FTSE, GBP/USD, EUR/GBP Forecast: What to expect from the Chancellor’s Budget
Chancellor John Healey will deliver his first UK budget, also the first under Prime Minister Andy Burnham, on Wednesday, October 28, usually around 12:30 GMT.

USD/CAD reversal risk builds as central bank showdown looms
USD/CAD has delivered a bullish reversal signal from established support, just as traders prepare for Fed and BoC decisions. Aggressive Canadian rate hike expectations and conflicting momentum signals make the coming session important.


EUR/USD weekly outlook: FOMC and ECB to set the tone
The current backdrop is modestly bearish. On Friday, the EUR/USD closed modestly lower, down for the third consecutive day. The pair also posted a weekly decline after staging a modest recovery attempt in the previous week. Out of the past 8 weeks, the EUR/USD has fallen on 6 occasions. There is not much supporting factors for the single currency right now. So, the upside remains capped.

StoneX Europe Ltd may make third party material available on this website which may contain information included but not limited to the conditions of financial markets. The material is for information purposes only and does not contain, and should not be construed as containing, investment advice and/or investment recommendation and/or an investment research and/or an offer of or solicitation for any transactions in financial instruments; any decision to enter into a specific transaction shall be made by the client following an assessment by him/her of their situation.
StoneX Europe Ltd makes no representation or warranty and assumes no liability as to the accuracy or completeness of the information provided, nor any loss arising from any investment based on a recommendation, forecast or other information supplied. You should always seek independent advice as to your suitability to speculate in any related markets and your ability to assume the associated risks, if you are at all unsure. We are not under any obligation to update any such material. Any opinion made may be personal to the author and may not reflect the opinion of StoneX Europe Ltd.