




USD Breakdown Test: USD/JPY, EUR/USD, USD/CAD, GBP/USD
The USD stares at fresh three-year lows just beneath current price, and the big question now is whether EUR/USD bulls can drive a breakout.
Share this:

U.S. Dollar, USD Talking Points:
- The U.S. Dollar has reversed gains from the move around last week’s FOMC meeting and at this point the currency sits just above the fresh three-year lows that were established earlier in June.
- FOMC members have sounded more dovish than what the forecasts last week suggested, and Fed-speak so far this week combined with diminished tensions in the Middle East have allowed the USD to push back towards lows.
- This is an archived webinar and you’re welcome to attend the next installment. Click here to register.
The U.S. Dollar has made a push for the lows and this erases an earlier week breakout that had continued a rally from last week’s lows. While inflation potential remained a hot button into this week’s open, both from tariffs as spoken to by Jerome Powell last week and more recently geopolitical tensions around Iran, dovish Fed-speak and a lowering of tensions have allowed the greenback to sink towards a key spot of support that’s been in-play fro the past couple of weeks.
At this point, the weekly chart of DXY is showing a trendline test with the fresh three-year lows established two weeks ago very nearby.
U.S. Dollar Weekly Chart
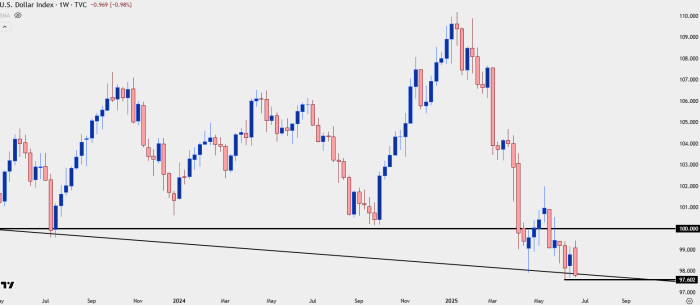
Chart prepared by James Stanley; data derived from Tradingview
USD Shorter-Term
At this point USD bears have an open door to push for fresh lows. That’s similar to early last week, but at that point sellers dried up and left a higher-low, which then led to the pullback move that ran into this week’s open.
This provides a bit of structure, with higher-lows at 97.62 and 97.69. In the webinar I went over a few scenarios along with related pairings. Fresh bearish exposure could prove challenging at this point given how aggressively the move has priced in over the past couple of days. This sets up possible resistance potential at 98.49 and 98.87, and for breakdown attempts, current support could be re-assigned as resistance for bearish continuation scenarios.
U.S. Dollar Four-Hour Chart
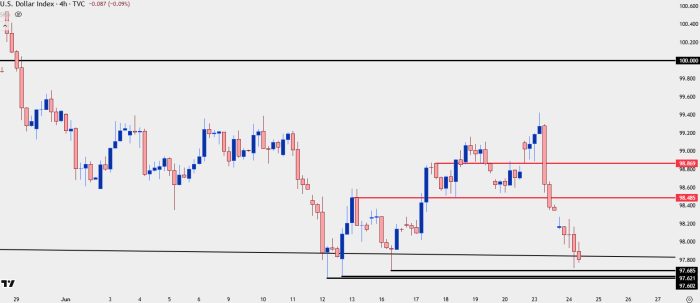
Chart prepared by James Stanley; data derived from Tradingview
USD/JPY
USD/JPY has held up a bit better than many other major pairs as there remains higher-lows from the 140.00 inflection in April and the 142.50 support in May.
For bigger picture USD bearish scenarios, a break of that 140.00 handle could have wide-ranging consequences but, for now, there’s a bullish trendline in-place and price is testing a key level around the 145.00 handle. For deeper support, there’s a trendline projection originating from the April lows that currently projects to around 143.50-143.75.
USD/JPY Daily Chart
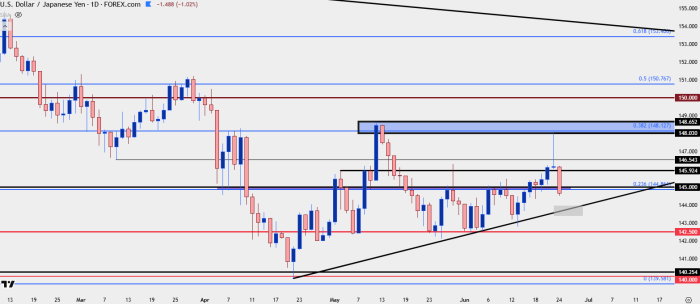
Chart prepared by James Stanley; data derived from Tradingview
EUR/USD
EUR/USD pushed up to a fresh three-year high this morning but notably, prices couldn’t continue very far beyond that level. I talked about this quite a bit in the webinar as that deduction didn’t necessarily mean that a reversal was imminent, but it did highlight some levels of importance that can be tracked for strategy around the pair.
EUR/USD Four-Hour Chart
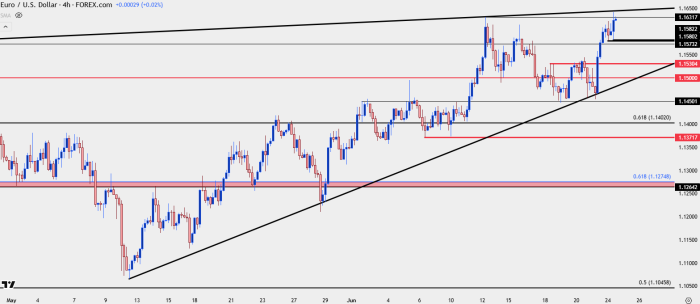
Chart prepared by James Stanley; data derived from Tradingview
EUR/USD Wedge
If we do see USD buyers defend higher-low support, EUR/USD remains as a venue that I think could be more attractive for swings. There’s a remaining rising wedge in play with the upper trendline so far holding the highs today.
EUR/USD Daily Chart
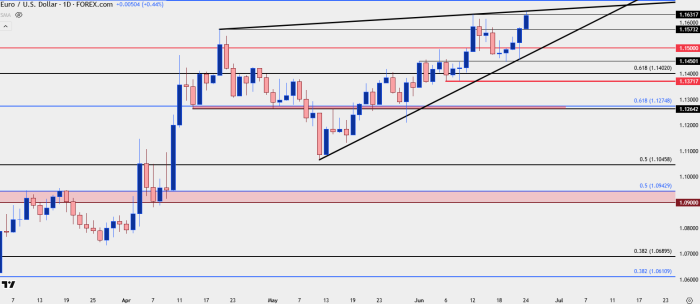
Chart prepared by James Stanley; data derived from Tradingview
GBP/USD
For USD-weakness scenarios, I still favor GBP/USD over EUR/USD, along with USD/CAD, as well.
In GBP/USD, the pair pulled back and held support at a really important spot last week and into this week, taken from the 1.3414 Fibonacci level. This is what held the highs last year and then in April, but it’s now become support.
GBP/USD Weekly Chart
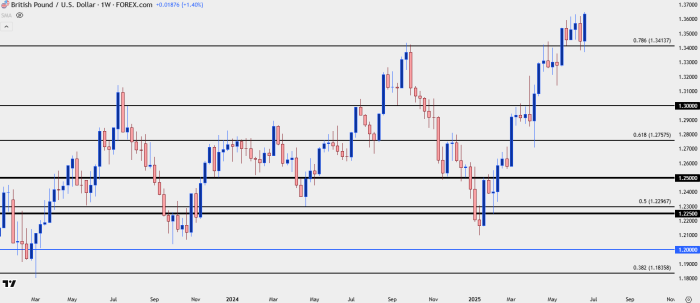
Chart prepared by James Stanley; data derived from Tradingview
GBP/USD Shorter-Term
The trend so far this week from support has been impressive in Cable. It also highlights a market that’s difficult to chase, but there is some structure to look to for higher-low support potential. A prior swing high at 1.3594 and the 1.3500 psychological levels stand out as reference points, with the 1.3389-1.3414 zone sitting below.
GBP/USD Four-Hour Chart
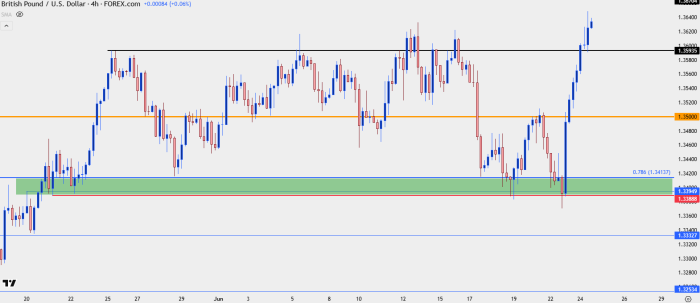
Chart prepared by James Stanley; data derived from Tradingview
USD/CAD
I wrote about this one yesterday as price had sunk back below the 1.3750 level, which remains an important spot. I still think USD/CAD remains an attractive venue for USD-weakness scenarios, but as looked at in the webinar, the pair is currently set up for counter-trend backdrops, as there’s been a hold of support at the 1.3679-1.3694 zone looked at in yesterday’s article.
Notably, sellers did drive down to the bottom of that zone, so this could end up as a shorter-term lower-low, but bearish strategies right now seem a bit more challenging. This does setup for a possible short-term bounce up to the 1.3743-1.3751 zone, which could suffice as a lower-high.
USD/CAD Four-Hour Chart
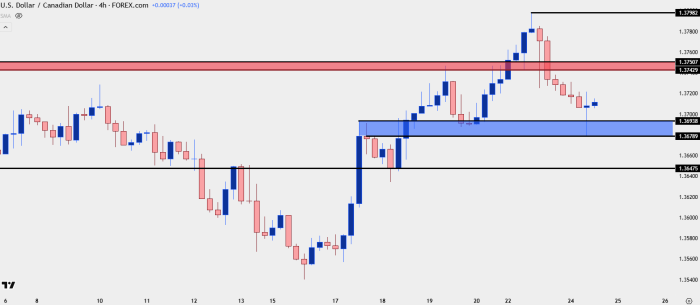
Chart prepared by James Stanley; data derived from Tradingview
The daily chart highlights why a hold of a lower-high here would be key for bearish continuation, a push above 1.3798 would constitute a higher-high to go along with a higher-low on the daily chart. This would then open up for deeper pullbacks, towards the 1.3889-1.3905 zone or perhaps even the 1.3980-1.4000 area that was last in-play in May.
USD/CAD Daily Chart
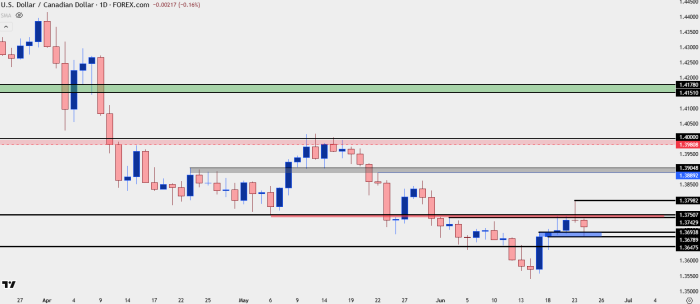
Chart prepared by James Stanley; data derived from Tradingview
--- written by James Stanley, Senior Strategist
Related tags:
Latest market news




The complete CFD trading experience
Award-winning platforms, competitive spreads, low commissions and dedicated support.
We live and breathe the markets and are dedicated to helping traders realise their ambitions as we continue to set the industry bar.
Economic calendar
Web Trader platform
Our sophisticated web-based platform is packed with features.
Related articles
Gold Price Outlook: XAU/USD Resistance at $4200 Sets Up for NFP
It was a strong sell-off to start the week in gold and despite a Tuesday bounce, sellers are continuing to push following a resistance hit at the $4200 level.
EUR/USD Forecast: Euro Struggles to Find Support Even After U.S. PCE Data
The euro continues to face a challenging environment in the short term. The currency has struggled to regain ground against a U.S. dollar that remains firmly supported, a dynamic reflected in EUR/USD, which has now recorded three consecutive losing sessions and a decline of roughly 0.6%.


Nasdaq Breakout Potential into Q4 for Melt Up Scenarios
The headlines seem negative in almost any place that you look, with surging Treasury yields and frothy AI valuations getting more and more attention. But, if it’s so bad, why hasn’t the Nasdaq melted down yet, even as the Fed has started hiking rates?
StoneX Europe Ltd may make third party material available on this website which may contain information included but not limited to the conditions of financial markets. The material is for information purposes only and does not contain, and should not be construed as containing, investment advice and/or investment recommendation and/or an investment research and/or an offer of or solicitation for any transactions in financial instruments; any decision to enter into a specific transaction shall be made by the client following an assessment by him/her of their situation.
StoneX Europe Ltd makes no representation or warranty and assumes no liability as to the accuracy or completeness of the information provided, nor any loss arising from any investment based on a recommendation, forecast or other information supplied. You should always seek independent advice as to your suitability to speculate in any related markets and your ability to assume the associated risks, if you are at all unsure. We are not under any obligation to update any such material. Any opinion made may be personal to the author and may not reflect the opinion of StoneX Europe Ltd.