




USD/CNH: Illiquid Break Below 200DMA Faces Reality Check as China Returns
Friday’s sharp USD/CNH drop may mark the beginning of a new bearish phase—or just a classic bear trap during thin holiday trade. With Chinese markets set to reopen, what happens next could steer the direction of Asia FX, particularly for the Aussie and Kiwi.
Share this:

- USD/CNH broke below 200DMA, key trendline and horizontal support on Friday
- Move occurred in illiquid trade during mainland China’s May Day holidays
- Monday's hammer candle hints at possible reversal, adding to the uncertainty
- CNH moves could weigh heavily on AUD and NZD given near-perfect recent correlations
- MACD and RSI suggest growing downside momentum—bearish setups favoured for now
Summary
An abrupt strengthening in the offshore traded Chinese yuan that saw it break several key technical levels in illiquid trade on Friday is about to be put to the test as mainland Chinese markets resume on Tuesday. What happens next could prove highly influential for the U.S. dollar’s fortunes against other Asian currencies, particularly the Australian and New Zealand dollars given the exceptionally tight correlations between the three against the greenback last week.
USD/CNH: Bear Trap or Start of Strengthening Trend
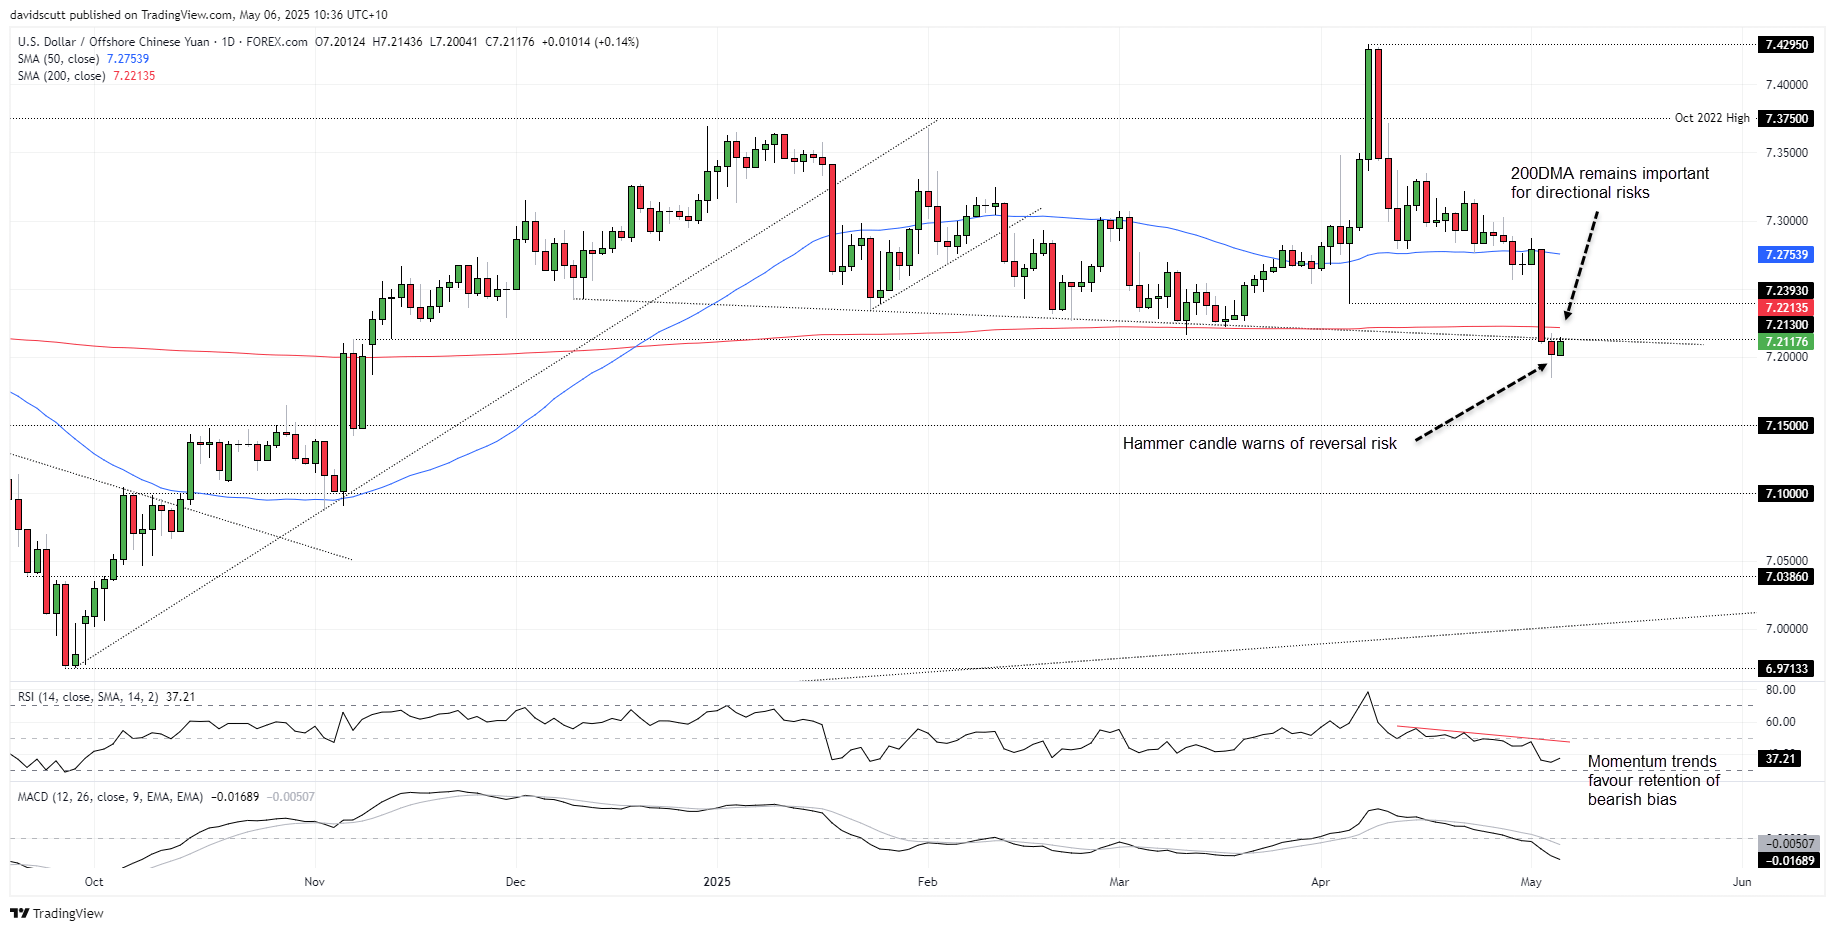
The sizeable bearish candle in USD/CNH on Friday was hard to miss, with the pair closing beneath the 200-day moving average, the December 2024 downtrend, and minor horizontal support at 7.2130. The price action hints USD/CNH may be on the cusp of a renewed CNH strengthening trend. But with the move coming at the start of the May Day holidays—a period typically marked by thin liquidity as mainland Chinese markets close for an extended long weekend—it’s a signal that demands scrutiny. It may ultimately prove a large bear trap as turnover normalises on Tuesday.
Source: TradingView
Monday’s hammer candle warns of reversal risk, though it too came amid holiday-affected trade. Should USD/CNH break and close back above the 200DMA today, it would suggest Friday’s move was a false break, opening the door to further upside—and downside for Asia FX more broadly. Correlations remain tight: on the daily timeframe over the past week, AUD and NZD logged correlation coefficients with CNH of 0.99 and 0.88 respectively—about as close to perfect as you’ll find.
Support sits at Monday’s low near 7.1850, followed by 7.1500 and 7.1000. Above the 200DMA, the April 4 low at 7.2393 is the first hurdle for bulls, with a break targeting the 50DMA.
Indicators such as MACD and RSI (14) point to increasing downside momentum, supporting a bearish bias. Selling rallies and downside breaks may remain the preferred strategy for now.
-- Written by David Scutt
Follow David on Twitter @scutty
How to trade with City Index
You can trade with City Index by following these four easy steps:
- Open an account, or log in if you’re already a customer
• Open an account in the UK
• Open an account in Australia
• Open an account in Singapore
- Search for the market you want to trade in our award-winning platform
- Choose your position and size, and your stop and limit levels
- Place the trade
Related tags:
Latest market news




The complete CFD trading experience
Award-winning platforms, competitive spreads, low commissions and dedicated support.
We live and breathe the markets and are dedicated to helping traders realise their ambitions as we continue to set the industry bar.
Economic calendar
Web Trader platform
Our sophisticated web-based platform is packed with features.
Related articles
RBA delivers 25bp hike, Bullock now the main event
The RBA delivered the expected 25bp hike, but Bullock’s press conference now looms as the bigger volatility risk for AUD/USD and the ASX 200.
Gold outlook: XAU/USD hammered, stretched and vulnerable to a sharp rebound
Gold is getting hammered for solid fundamental reasons, but history suggests extreme four-hourly oversold conditions can produce violent countertrend rallies.
EUR/USD, USD/JPY Outlook: Oil, yields and an FX identity crisis
Crude oil is setting the tone across rates and FX, leaving EUR/USD vulnerable and USD/JPY caught between higher Treasury yields and the growing threat of intervention
StoneX Europe Ltd may make third party material available on this website which may contain information included but not limited to the conditions of financial markets. The material is for information purposes only and does not contain, and should not be construed as containing, investment advice and/or investment recommendation and/or an investment research and/or an offer of or solicitation for any transactions in financial instruments; any decision to enter into a specific transaction shall be made by the client following an assessment by him/her of their situation.
StoneX Europe Ltd makes no representation or warranty and assumes no liability as to the accuracy or completeness of the information provided, nor any loss arising from any investment based on a recommendation, forecast or other information supplied. You should always seek independent advice as to your suitability to speculate in any related markets and your ability to assume the associated risks, if you are at all unsure. We are not under any obligation to update any such material. Any opinion made may be personal to the author and may not reflect the opinion of StoneX Europe Ltd.