


USD/JPY Weekly Outlook: Volatility Has Left the Building
The yen has ignored broad dollar weakness, falling Treasury yields and renewed market turbulence. Yet its relationship with US interest rates remains intact. So why is USD/JPY going absolutely nowhere fast?
Share this:

USD/JPY is going nowhere fast, showing little response to renewed volatility in equity markets or a sharp decline in US Treasury yields, leaving the pair range-bound as it has been for weeks. With the Fed in blackout ahead of its October meeting and next week's economic calendar devoid of major risk events, it's hard to see what might break the deadlock.
Yen volatility has virtually disappeared
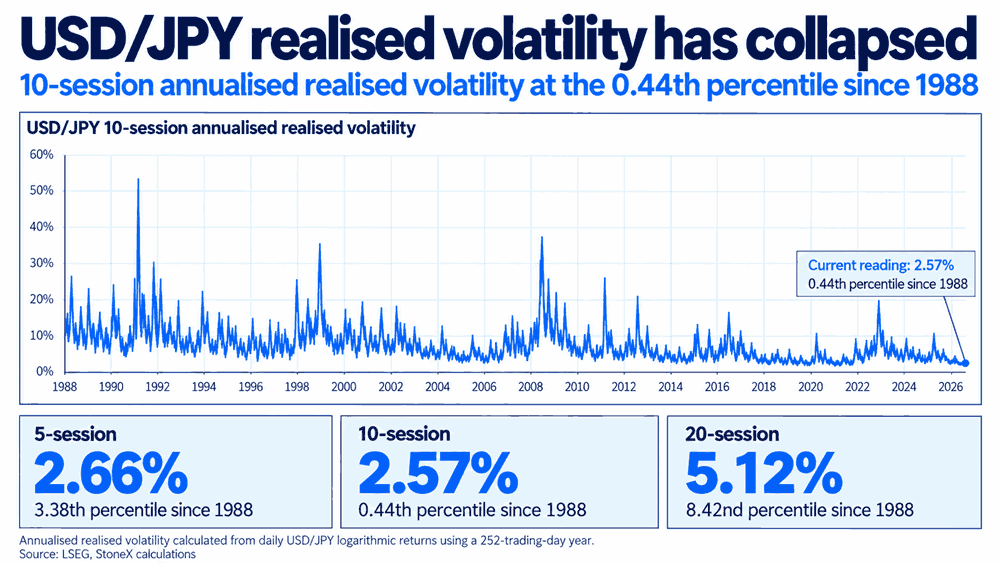
Yen movement, at least against the US dollar, is essentially dead, with realised volatility measuring just 2.57% over the past fortnight, sitting in the 0.44th percentile of all rolling 10-session windows going back to 1988.
Source: LSEG
Similarly low readings have been recorded over the past week and month, even though the latter still reflects a period when intervention risk remained elevated following episodes involving Japan's Ministry of Finance and US Treasury officials earlier this year.
Put bluntly, it's extremely quiet.
Dollar weakness fails to boost yen
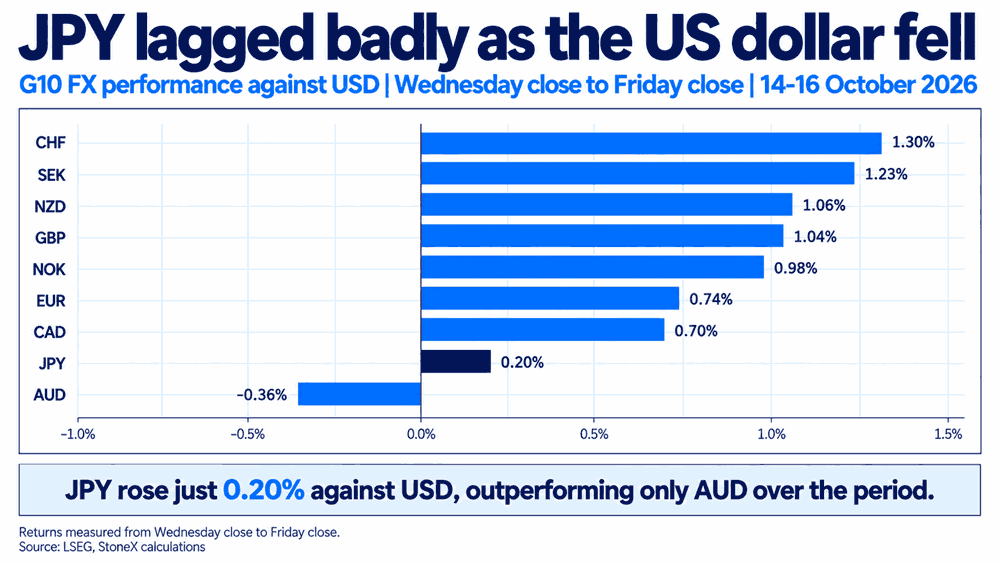
The lack of movement is demonstrated by how unresponsive the pair has become to developments in the broader macro environment, with even pronounced US dollar selling late last week failing to generate meaningful yen strength.
Source: LSEG
Between Wednesday's and Friday's closes, the yen appreciated just 0.20% against the dollar, outperforming only the Australian dollar. However, the Aussie's weakness reflected a sharp recalibration of RBA rate hike expectations following a much softer-than-expected Australian employment report.
Strip out that domestic influence and the yen was comfortably the worst-performing G10 currency against the dollar, with every other currency gaining at least 0.70% over the same period.
Falling US yields fail to lift the yen
For a pair long known for its relationship with yield differentials, particularly as a conduit for carry trades, there was also remarkably little response to the substantial decline in US Treasury yields last week.
The US 10-year yield fell 14.6 basis points, its largest weekly decline since February, while the 30-year yield shed 16.2 basis points, its steepest fall since April 2025.
Source: TradingView
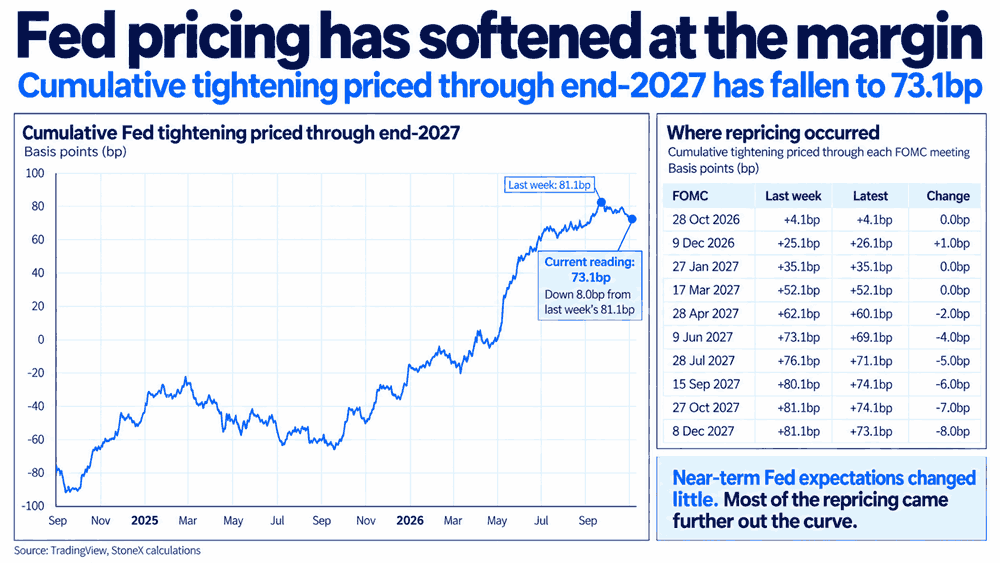
Nor did the yen show much interest in a further unwind in hawkish Fed pricing, with cumulative hikes priced through the end of next year falling from 81.1 to 73.1 basis points over the week. Most of the recalibration occurred further out the curve, rather than in implied pricing for the remaining meetings this year.
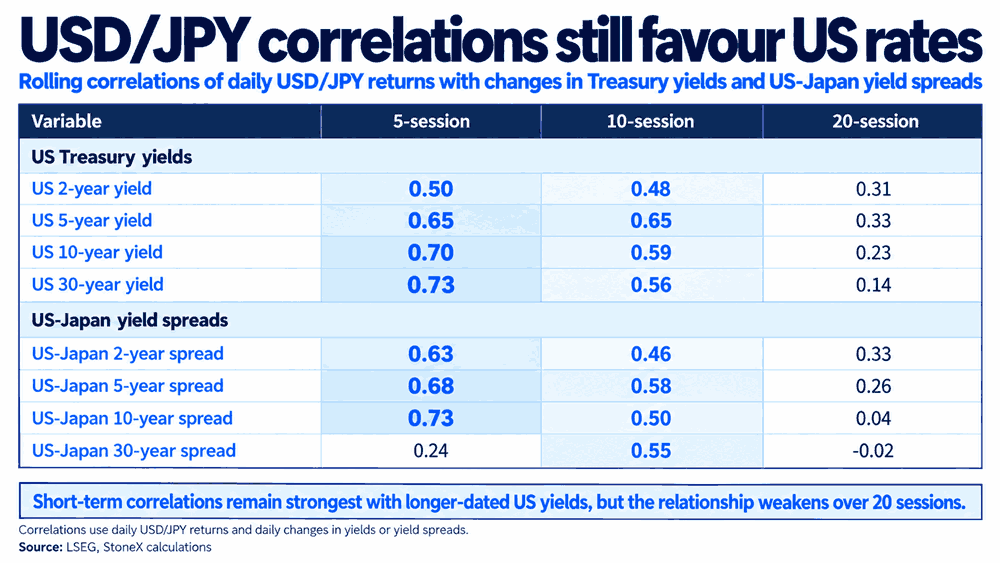
However, looking at the correlation matrix below, it's clear that USD/JPY has not stopped responding to moves in US interest rates altogether, with the data showing a relatively strong positive relationship with outright US Treasury yields and US-Japan yield spreads, particularly over shorter timeframes.
Source: LSEG
Over the past five sessions, correlations with US 10-year and 30-year Treasury yields stood at +0.70 and +0.73 respectively, while the relationship with the US-Japan 10-year yield spread was also +0.73. These relationships are strongest over shorter timeframes, although positive correlations remain evident across most maturities over 10 and 20 sessions, albeit generally weaker.
While the directional relationship remains intact on a day-to-day basis, what's clear is that the magnitude of the movements in USD/JPY has been remarkably small in comparison.
Flash PMIs to the rescue?
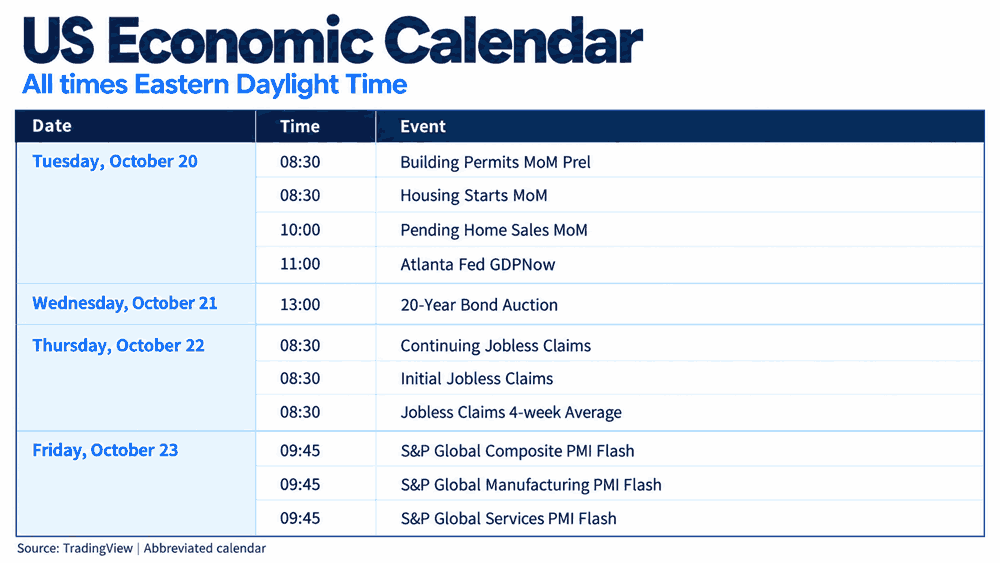
Even allowing for the abbreviated US economic calendar below, which includes several events that normally wouldn't get a mention, there's precious little to get excited about next week.
Source: TradingView
The 20-year Treasury auction is an awkward tenor that can give misleading signals about broader demand for longer-dated US government debt, which has generally been strong recently. Meanwhile, there's been little in weekly jobless claims to suggest any meaningful deterioration in labour market conditions.
It's testament to the marketing genius of S&P Global that arguably the most interesting thing on the calendar is the flash PMIs, given there's just about nothing else out there that really matters.
While 98 times out of 100 the report comes and goes without generating even an iota of interest, last month's blockbuster September readings were an exception, producing a substantial reaction in US Treasury yields and the dollar. With that strength now in the price, a failure to replicate it in October risks unwinding some of the sentiment generated by the previous report.
When hot CPI isn’t enough
Source: TradingView
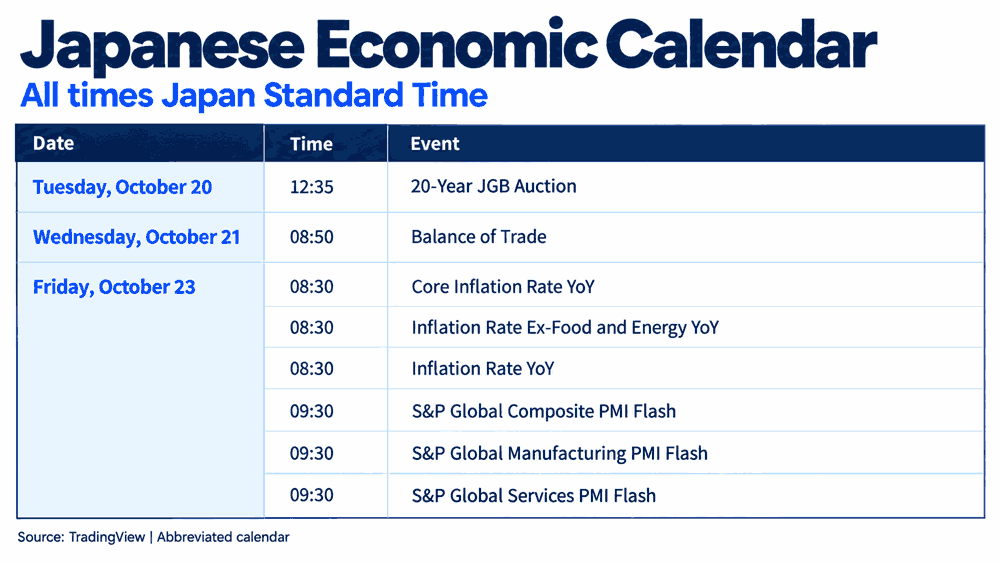
Unfortunately, there's precious little on the Japanese calendar to excite your scribe either, with another 20-year government bond auction and trade figures the only releases of note until Friday's national inflation report.
But given the Tokyo CPI figures released three weeks ago were red hot and did absolutely nothing for USD/JPY, how the national figures are going to make any difference is anyone's guess. As our previous Tokyo CPI study demonstrated, Tokyo inflation provides a highly accurate guide to national inflation yet generates virtually no meaningful volatility in the pair. I suspect you could look at the price reaction after Friday's release and barely know the report had come out.
Playing pong between key moving averages
Source: TradingView
Looking at the daily chart insert, it's much the same story as last week with USD/JPY continuing to play pong between the 200-day simple moving average overhead and the 50-day moving average underneath. There have been a couple of occasions when a breakout looked possible, but neither side has managed to sustain a move, leaving the pair stuck in the same range it has occupied for weeks.
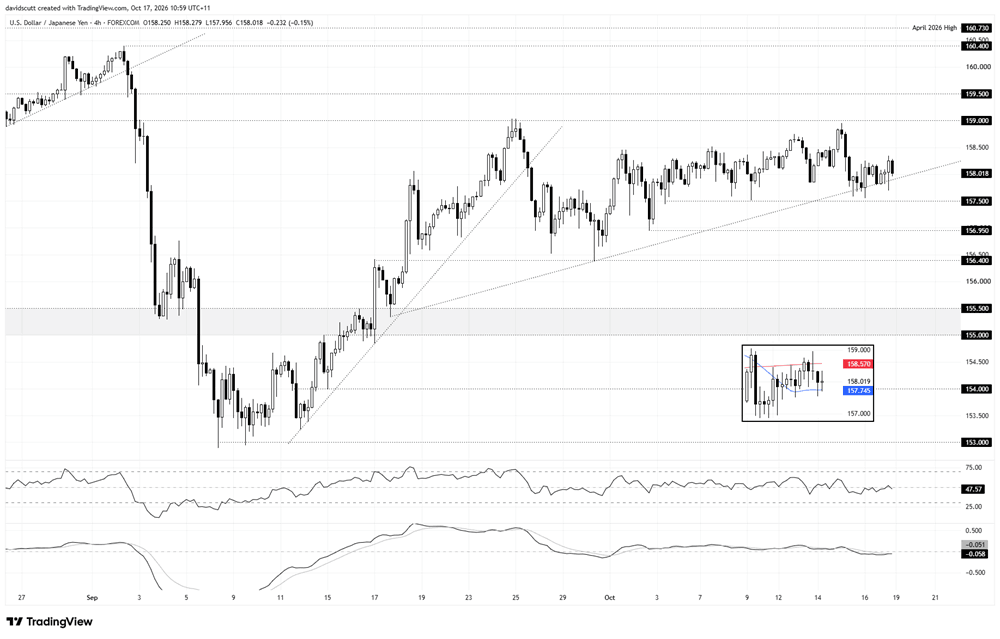
On the four-hourly chart, there's arguably a slight upward bias, although even that may be too generous. Stepping back, USD/JPY has traded largely between 157.50 on the downside and just below 159.00 on the upside since the start of October, making those the immediate levels to watch.
I've illustrated a short-term uptrend that the price appears to be responding to, although whether it's meaningful remains questionable. For now, it sits just beneath the price around 158.00, providing another reference level.
Above 159.00, resistance is located at 159.50 and 160.40. However, a move towards those levels would likely require traders to largely dismiss the threat of intervention, alongside a substantial reversal higher in US Treasury yields sufficient to spur a broader US dollar recovery. That's difficult to envisage at present.
On the downside, a break beneath 157.56 would bring 156.95, the October 2 low, into focus, followed by 156.40 and the broader support zone between 155.00 and 155.50. The latter absorbed substantial selling pressure during intervention episodes earlier this year, making it an important area to watch should the pair come under renewed pressure.
Like the price action, the oscillators are offering zilch in terms of directional signals. RSI (14) is bang on neutral around 50, while MACD is flatlining around the zero line.
For now, playing the range looks the way to go until the price provides a compelling reason to do otherwise.
Latest market news




The complete CFD trading experience
Award-winning platforms, competitive spreads, low commissions and dedicated support.
We live and breathe the markets and are dedicated to helping traders realise their ambitions as we continue to set the industry bar.
Economic calendar
Web Trader platform
Our sophisticated web-based platform is packed with features.
Related articles
USD/JPY Weekly Outlook: Volatility Has Left the Building
The yen has ignored broad dollar weakness, falling Treasury yields and renewed market turbulence. Yet its relationship with US interest rates remains intact. So why is USD/JPY going absolutely nowhere fast?
Swiss Franc Forecast: USD/CHF Seven-Week Rally Reverses From Yearly Highs 10 16 2026
A sharp rejection from fresh highs has shifted momentum in favor of USD/CHF bears, raising the stakes for a critical support test.


Nasdaq 100 forecast: Tech stocks not out of woods yet
US index futures pushed higher in the first half of Friday’s session, taking cues from a strong performance from European equities. Both European and US equity futures extending yesterday’s impressive recovery after the sharp sell-off earlier in the week. But the lingering concerns around the AI investment cycle remain, while bond markets were easing lower again, lifting yields.

StoneX Europe Ltd may make third party material available on this website which may contain information included but not limited to the conditions of financial markets. The material is for information purposes only and does not contain, and should not be construed as containing, investment advice and/or investment recommendation and/or an investment research and/or an offer of or solicitation for any transactions in financial instruments; any decision to enter into a specific transaction shall be made by the client following an assessment by him/her of their situation.
StoneX Europe Ltd makes no representation or warranty and assumes no liability as to the accuracy or completeness of the information provided, nor any loss arising from any investment based on a recommendation, forecast or other information supplied. You should always seek independent advice as to your suitability to speculate in any related markets and your ability to assume the associated risks, if you are at all unsure. We are not under any obligation to update any such material. Any opinion made may be personal to the author and may not reflect the opinion of StoneX Europe Ltd.