





USDBRL at Inflection Point after Yesterdays Poor Retail Sales
If the data continues to be as poor as retail sales, the USD/BRL could move higher.
Share this:

On Wednesday, Brazil released its Retail Sales data for December. The MoM number was -0.1% vs 0.4% expected and an upwardly revised 0.7% for November. This was the first drop in retail sales for Brazil since April 2019. In December, the Central Bank of Brazil cut rates by 50 bps and last week, cut another 25 bps to bring the key Selic rate to 4.25%. The bank citied the global economic slowdown, uncertainties from the Coronavirus, and a slow domestic recovery. Yesterday’s retail sales data only added to the evidence of the last point.
Not surprisingly, USD/BRL (and other EM currencies) has been trading higher in the wake of recent rate cuts, bringing the Real to all time lows. However today price is trading near 4.3212, down over 0.75% on the day. The pair paused at the 127.2% Fibonacci extension from the highs of mid-September 2018 to the lows of October 26th, 2018, near 4.3791. In addition, USD/BRL is running into an upper slowing trendline (acting as resistance) at that same level, going back to November 26th, 2018. Although there are still a few hours left in the trading day, this resistance level has caused the pair to reverse and trade lower on the day, forming a bearish engulfing candlestick formation. This reversal has allowed the RSI on a daily timeframe to move from overbought territory back into neutral territory. If prices do move higher above the 4.3791 level, the next resistance isn’t until the 161.8% Fibonacci extension from the previously mentioned timeframe near 4.5954.
Source: Tradingview, City Index
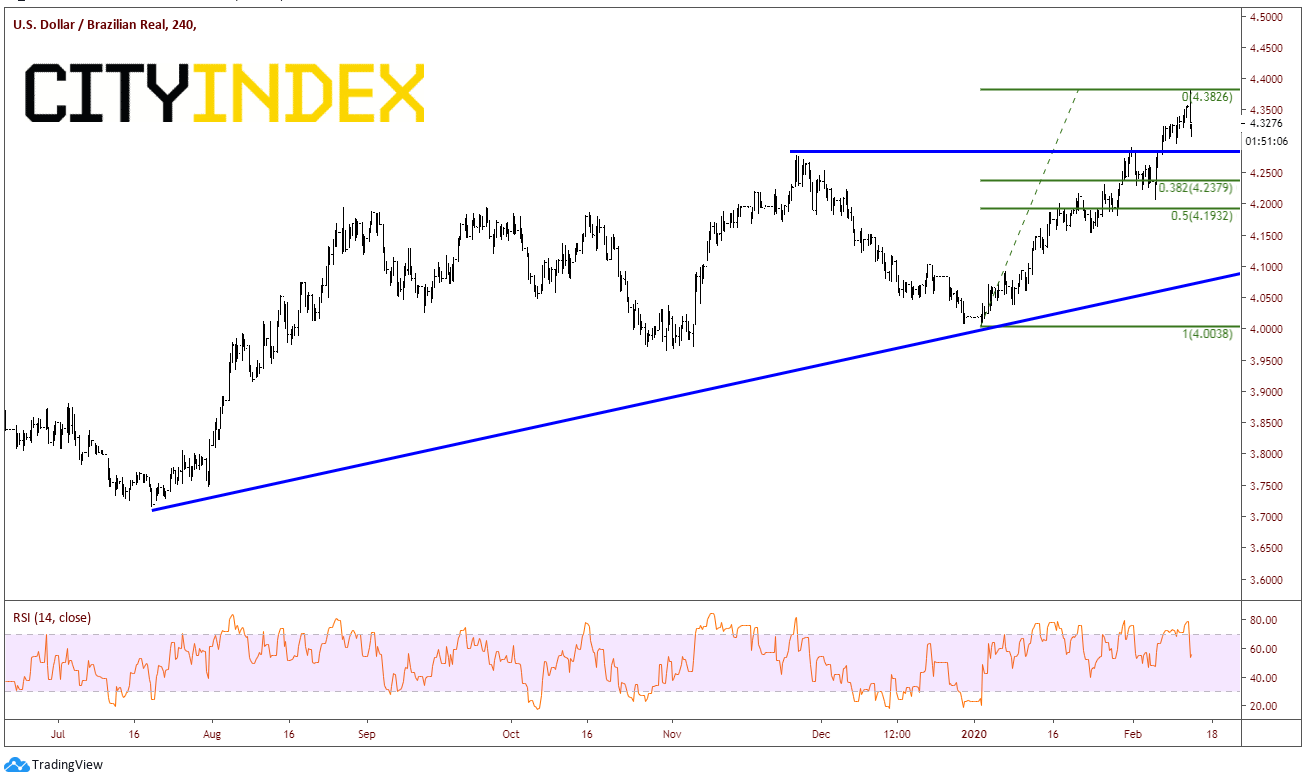
On a 240-minute timeframe, horizontal support comes across at prior highs near 4.2900. Below that is the 38.2% Fibonacci retracement level and the 50% retracement level from the lows on January 2nd to today’s highs near 4.2379 and 3.1932, respectively. The RSI on the 240-minute timeframe, has also moved lower into neutral territory.
Source: Tradingview, City Index
As USD/BRL pulls back from the overbought,127.2% extension level, keep in mind that the Central Bank of Brazil did say they would be data dependent moving forward. However, if the data continues to be as poor as yesterday’s retail sales data, the USD/BRL could move higher, especially if it looks like they will cut rates again at their March 18th meeting.
On Wednesday, Brazil released its Retail Sales data for December. The MoM number was -0.1% vs 0.4% expected and an upwardly revised 0.7% for November. This was the first drop in retail sales for Brazil since April 2019. In December, the Central Bank of Brazil cut rates by 50 bps and last week, cut another 25 bps to bring the key Selic rate to 4.25%. The bank citied the global economic slowdown, uncertainties from the Coronavirus, and a slow domestic recovery. Yesterday’s retail sales data only added to the evidence of the last point.
Not surprisingly, USD/BRL (and other EM currencies) has been trading higher in the wake of recent rate cuts, bringing the Real to all time lows. However today price is trading near 4.3212, down over 0.75% on the day. The pair paused at the 127.2% Fibonacci extension from the highs of mid-September 2018 to the lows of October 26th, 2018, near 4.3791. In addition, USD/BRL is running into an upper slowing trendline (acting as resistance) at that same level, going back to November 26th, 2018. Although there are still a few hours left in the trading day, this resistance level has caused the pair to reverse and trade lower on the day, forming a bearish engulfing candlestick formation. This reversal has allowed the RSI on a daily timeframe to move from overbought territory back into neutral territory. If prices do move higher above the 4.3791 level, the next resistance isn’t until the 161.8% Fibonacci extension from the previously mentioned timeframe near 4.5954.
Source: Tradingview, FOREX.com
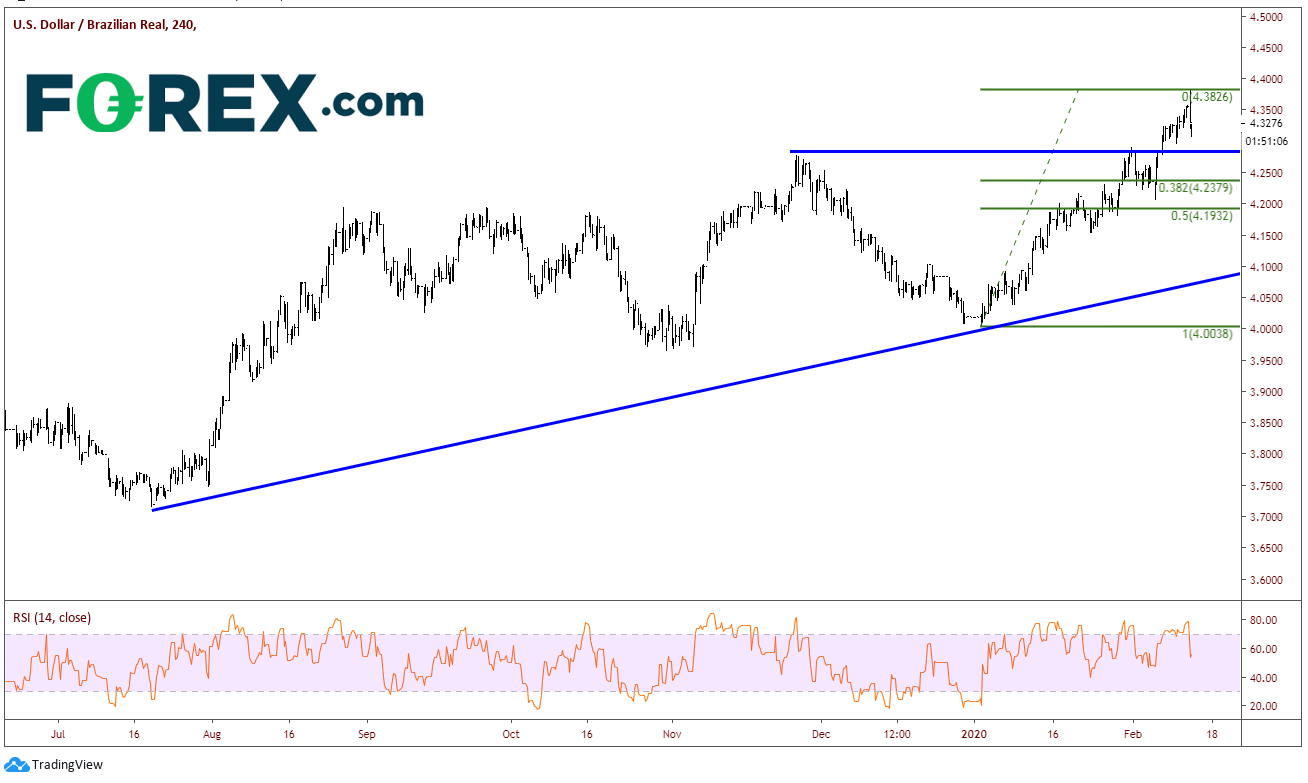
On a 240-minute timeframe, horizontal support comes across at prior highs near 4.2900. Below that is the 38.2% Fibonacci retracement level and the 50% retracement level from the lows on January 2nd to today’s highs near 4.2379 and 3.1932, respectively. The RSI on the 240-minute timeframe, has also moved lower into neutral territory.
Source: Tradingview, FOREX.com
As USD/BRL pulls back from the overbought,127.2% extension level, keep in mind that the Central Bank of Brazil did say they would be data dependent moving forward. However, if the data continues to be as poor as yesterday’s retail sales data, the USD/BRL could move higher, especially if it looks like they will cut rates again at their March 18th meeting.
Related tags:
Latest market news




The complete CFD trading experience
Award-winning platforms, competitive spreads, low commissions and dedicated support.
We live and breathe the markets and are dedicated to helping traders realise their ambitions as we continue to set the industry bar.
Economic calendar
Web Trader platform
Our sophisticated web-based platform is packed with features.
Related articles
AUD/USD hammered by US yields and fading RBA hike bets
US yields, dollar strength and fading RBA hike bets have combined to drive AUD/USD to fresh multi-month lows. The macro and technical bias remains bearish, although history suggests parts of the move are now reaching unusually stretched levels.
EUR/USD Forecast: Euro Struggles to Find Support Even After U.S. PCE Data
The euro continues to face a challenging environment in the short term. The currency has struggled to regain ground against a U.S. dollar that remains firmly supported, a dynamic reflected in EUR/USD, which has now recorded three consecutive losing sessions and a decline of roughly 0.6%.

Canadian Dollar Forecast: USD/CAD Four-Week Rally Eyes Yearly Highs 9 30 2026
USD/CAD has advanced in 14 of the past 15 sessions, but stretched momentum raises the stakes as major resistance and NFP come into focus.

StoneX Europe Ltd may make third party material available on this website which may contain information included but not limited to the conditions of financial markets. The material is for information purposes only and does not contain, and should not be construed as containing, investment advice and/or investment recommendation and/or an investment research and/or an offer of or solicitation for any transactions in financial instruments; any decision to enter into a specific transaction shall be made by the client following an assessment by him/her of their situation.
StoneX Europe Ltd makes no representation or warranty and assumes no liability as to the accuracy or completeness of the information provided, nor any loss arising from any investment based on a recommendation, forecast or other information supplied. You should always seek independent advice as to your suitability to speculate in any related markets and your ability to assume the associated risks, if you are at all unsure. We are not under any obligation to update any such material. Any opinion made may be personal to the author and may not reflect the opinion of StoneX Europe Ltd.