



USD/TRY lurches higher as traders question the central bank’s independence, 10.00 next?
Traders’ fears that the nominally independent central bank is becoming hopelessly politicized are being realized, causing a widespread loss of confidence in the lira...
Share this:

Perhaps for those used to trading the latest NFT or meme stock, the chart of USD/TRY may not look to unusual…but for FX traders, the ongoing collapse in the currency of a country in the top 20 of GDP is a truly astounding development.
What are Emerging Market economies?
Last week, my colleague Joe Perry identified the pair’s fresh record high on the back of geopolitical tensions and surging inflation, but the catalyst for the latest swoon in the lira is even more alarming. In a late-night decree on Thursday, Turkey’s President Recep Tayyip Erdogan dismissed several more of the central bank’s deputy governors, including the only one who opposed last month’s surprising interest rate cut.
In other words, traders’ fears that the nominally independent central bank is becoming hopelessly politicized are being realized, causing a widespread loss of confidence in the lira. According to central bank data, foreign investors held just $6B in government bonds at the halfway point of the year, down more than 90% from the $61.5B in Turkish bonds that foreign investors held as recently as 2013.
Trade USD/TRY now: Login or open a new account!
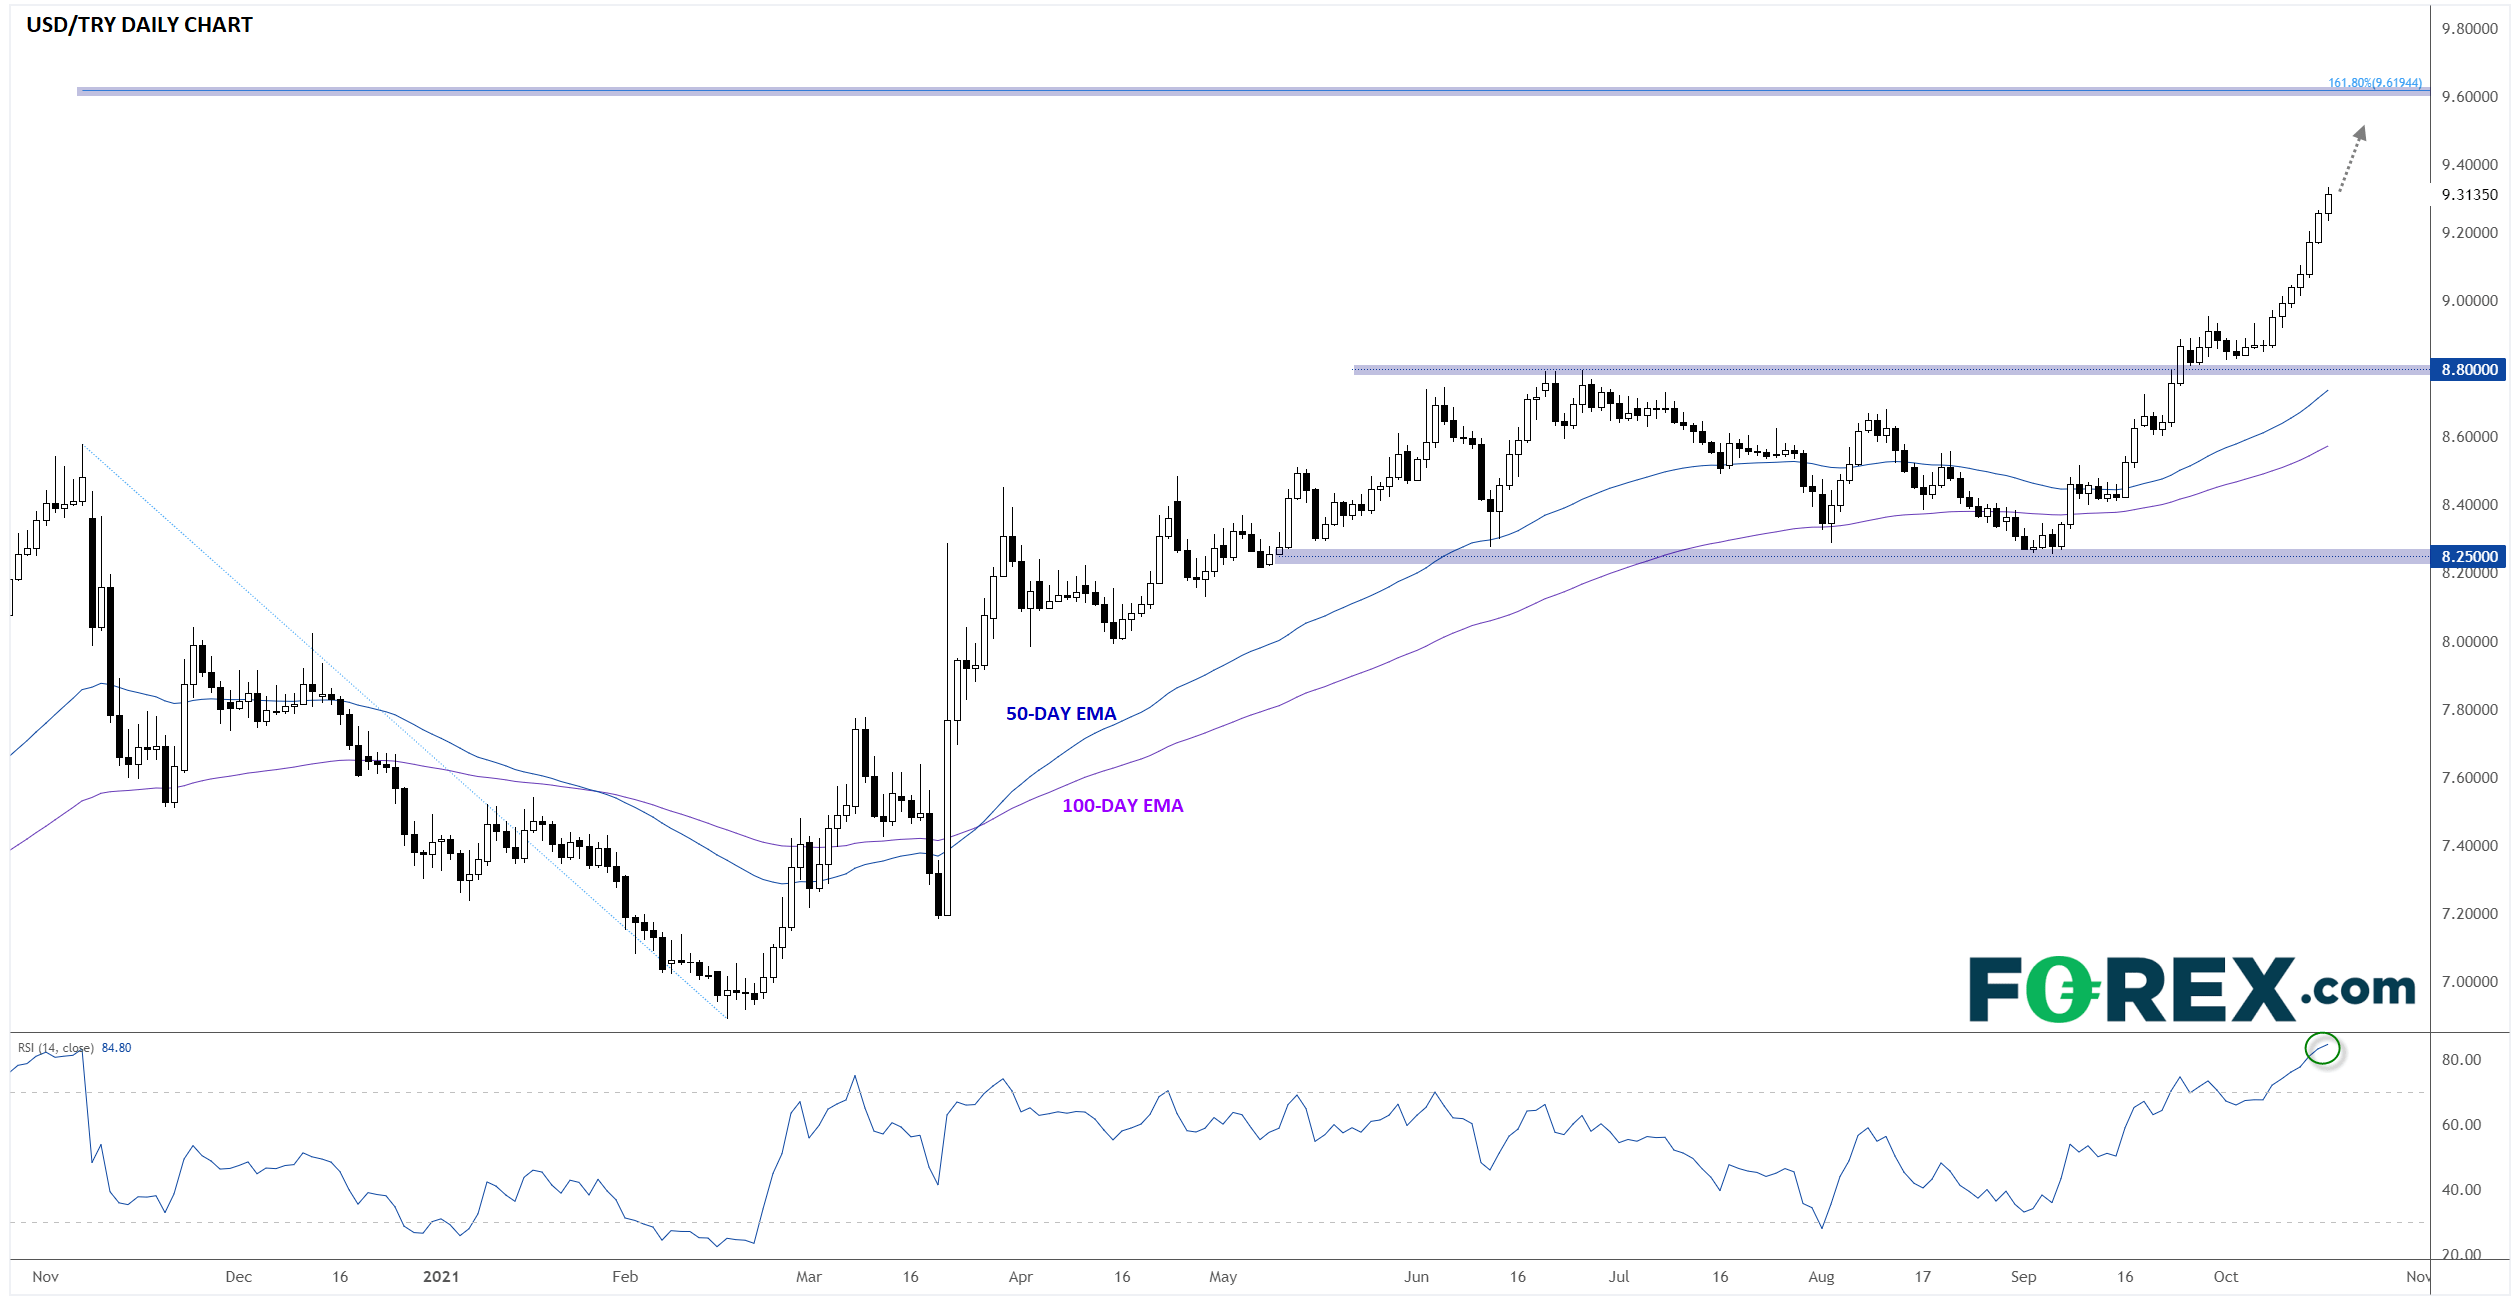
Turning our attention to the chart, USD/TRY is working on its seventh consecutive daily gain after blasting through the 9.00 level last week. With prices at a fresh record high, there are no levels of previous resistance nearby, though the 161.8% Fibonacci extension of the 3-month pullback that started this time last year looms up near 9.60 as a logical next target for bulls. Beyond that, the psychologically-significant 10.00 level may come into play next.
Source: StoneX, TradingView
It is notable that the 14-day RSI indicator is above 80, at an area that has previous marked short-term peaks in the USD/TRY exchange rate. That said, the country’s economic and monetary policy outlook hasn’t been this precarious before, so rates could certainly continue to surge regardless of an overbought reading on a technical indicator.
The next hurdle for the beleaguered currency is another CBRT monetary policy meeting on Thursday. Based on last week’s actions and the recent price action, investors a bracing for another interest rate cut, further deterioration in the value of the lira, and continued inflation in the country.
How to trade with FOREX.com
Follow these easy steps to start trading with FOREX.com today:
- Open a Forex.com account, or log-in if you’re already a customer.
- Search for the pair you want to trade in our award-winning platform.
- Choose your position and size, and your stop and limit levels.
- Place the trade.
Perhaps for those used to trading the latest NFT or meme stock, the chart of USD/TRY may not look to unusual…but for FX traders, the ongoing collapse in the currency of a country in the top 20 of GDP is a truly astounding development.
What are Emerging Market economies?
Last week, my colleague Joe Perry identified the pair’s fresh record high on the back of geopolitical tensions and surging inflation, but the catalyst for the latest swoon in the lira is even more alarming. In a late-night decree on Thursday, Turkey’s President Recep Tayyip Erdogan dismissed several more of the central bank’s deputy governors, including the only one who opposed last month’s surprising interest rate cut.
In other words, traders’ fears that the nominally independent central bank is becoming hopelessly politicized are being realized, causing a widespread loss of confidence in the lira. According to central bank data, foreign investors held just $6B in government bonds at the halfway point of the year, down more than 90% from the $61.5B in Turkish bonds that foreign investors held as recently as 2013.
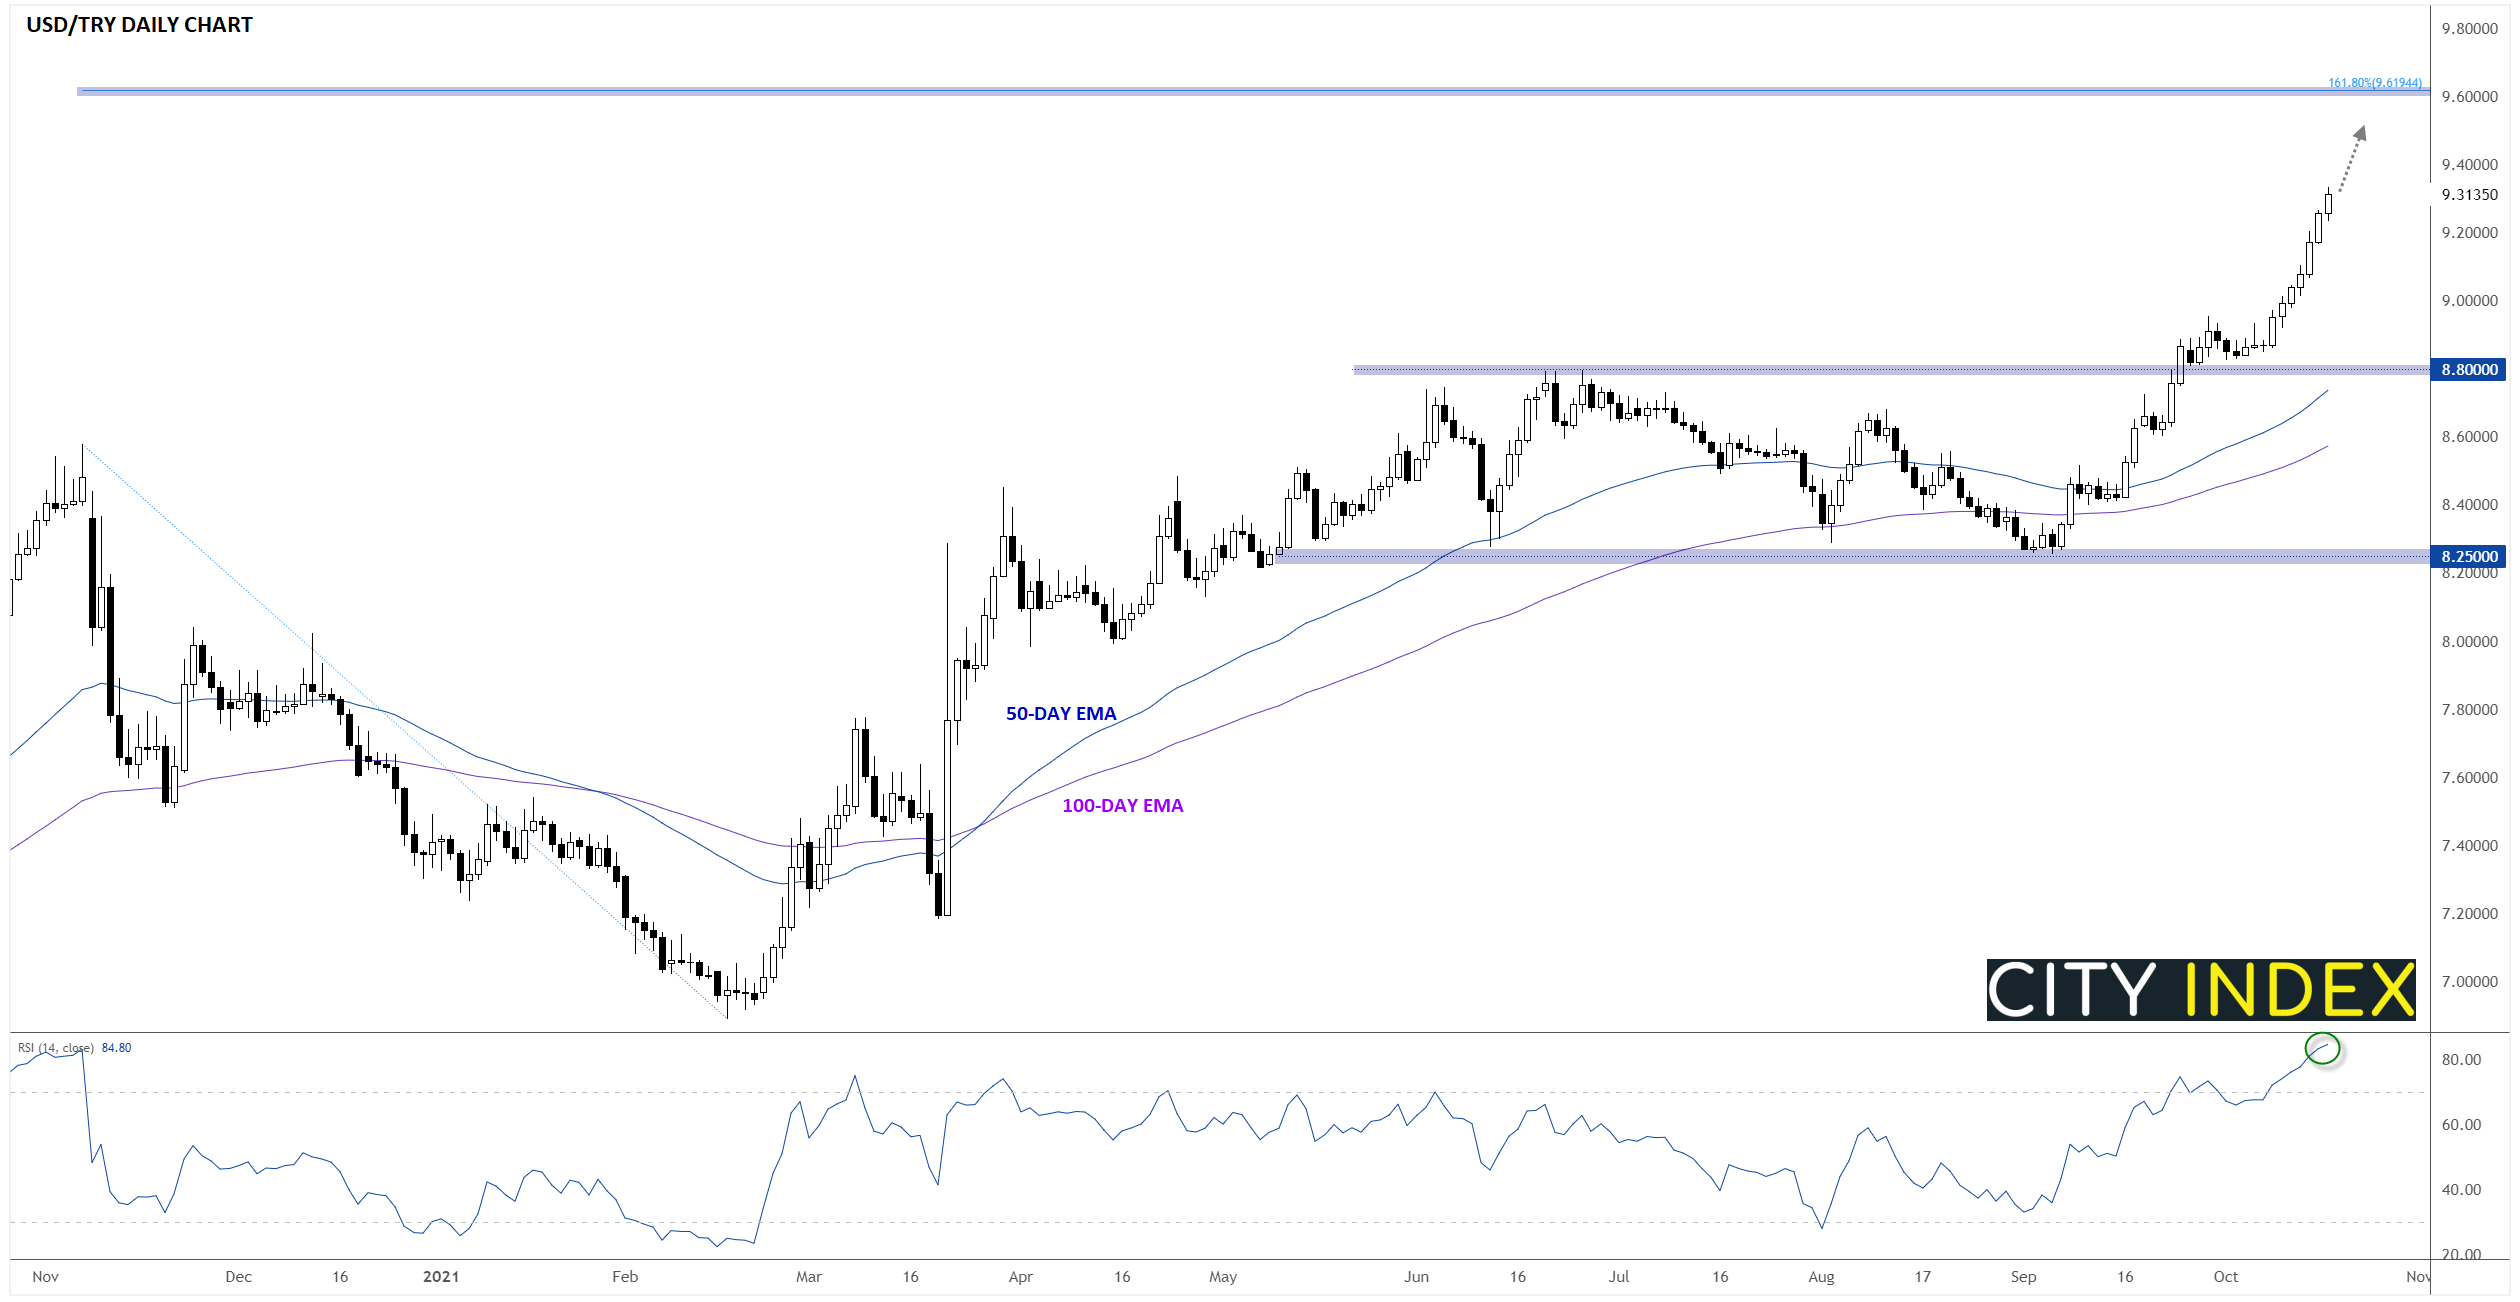
Turning our attention to the chart, USD/TRY is working on its seventh consecutive daily gain after blasting through the 9.00 level last week. With prices at a fresh record high, there are no levels of previous resistance nearby, though the 161.8% Fibonacci extension of the 3-month pullback that started this time last year looms up near 9.60 as a logical next target for bulls. Beyond that, the psychologically-significant 10.00 level may come into play next.
Source: StoneX, TradingView
It is notable that the 14-day RSI indicator is above 80, at an area that has previous marked short-term peaks in the USD/TRY exchange rate. That said, the country’s economic and monetary policy outlook hasn’t been this precarious before, so rates could certainly continue to surge regardless of an overbought reading on a technical indicator.
The next hurdle for the beleaguered currency is another CBRT monetary policy meeting on Thursday. Based on last week’s actions and the recent price action, investors a bracing for another interest rate cut, further deterioration in the value of the lira, and continued inflation in the country.
How to trade with City Index
You can trade easily trade with City Index by using these four easy steps:
- Open an account, or log in if you’re already a customer
• Open an account in the UK
• Open an account in Australia
• Open an account in Singapore
- Search for the company you want to trade in our award-winning platform
- Choose your position and size, and your stop and limit levels
- Place the trade
Latest market news




The complete CFD trading experience
Award-winning platforms, competitive spreads, low commissions and dedicated support.
We live and breathe the markets and are dedicated to helping traders realise their ambitions as we continue to set the industry bar.
Economic calendar
Web Trader platform
Our sophisticated web-based platform is packed with features.
Related articles
US Dollar, GBP/USD, USD/CAD, USD/CHF, Gold Weekly Technical Outlook 11 2 2026
Sr. Technical Strategist Michael Boutros highlights the levels that matter on the USD Majors, commodities, and equity indices charts this week.

US Midterm Forecast: The Key Risks for Traders to Watch Through the US Elections
Prediction markets are pricing in nearly 75% odds of a Democratic sweep in this week’s US midterm elections, a development that would result in a split from the single party Republican rule of the past two years - what will it mean for markets?

GBP/USD outlook: Currency Pair of the Week | November 2, 2026
The GBP/USD heads into a crowded week of event risk, with the midterm elections, a Bank of England rate decision and Friday's non-farm payrolls report all capable of moving markets sharply. The greenback remains fundamentally well supported by a hawkish Federal Reserve, but much of that is already priced in, while the renewed sell-off in technology stocks has exposed its vulnerability.

StoneX Europe Ltd may make third party material available on this website which may contain information included but not limited to the conditions of financial markets. The material is for information purposes only and does not contain, and should not be construed as containing, investment advice and/or investment recommendation and/or an investment research and/or an offer of or solicitation for any transactions in financial instruments; any decision to enter into a specific transaction shall be made by the client following an assessment by him/her of their situation.
StoneX Europe Ltd makes no representation or warranty and assumes no liability as to the accuracy or completeness of the information provided, nor any loss arising from any investment based on a recommendation, forecast or other information supplied. You should always seek independent advice as to your suitability to speculate in any related markets and your ability to assume the associated risks, if you are at all unsure. We are not under any obligation to update any such material. Any opinion made may be personal to the author and may not reflect the opinion of StoneX Europe Ltd.