



VIX Index Early warning to the stock markets but yet to confirm downturn
On Thursday, U.S. stocks closed sharply lower amid tech shares sell-off. Nasdaq 100 plunged 5.2%, the largest daily decline since March. S&P 500 slumped 3.5% and the Dow Jones Industrial Average lost 2.8%. The VIX Index, a measure of expected volatility based on S&P 500 index options, rallied 26.5% to a 3-month high of 33.60, the biggest jump since June.
Share this:

On Thursday, U.S. stocks closed sharply lower amid tech shares sell-off. Nasdaq 100 plunged 5.2%, the largest daily decline since March. S&P 500 slumped 3.5% and the Dow Jones Industrial Average lost 2.8%. The VIX Index, a measure of expected volatility based on S&P 500 index options, rallied 26.5% to a 3-month high of 33.60, the biggest jump since June.
The three major indices had climbed more than 30% since March, analysts begin to reassess return prospects and it would not be surprised to see investors taking profit or hedging their position, hence causing a surge in VIX. It might still be too soon to conclude a downturn in equity market's trend.
Meanwhile, the closely watched non-farm payrolls report for August will be released (+1.35 million jobs, jobless rate at 9.8% expected), which may bring volatility to the stock market.
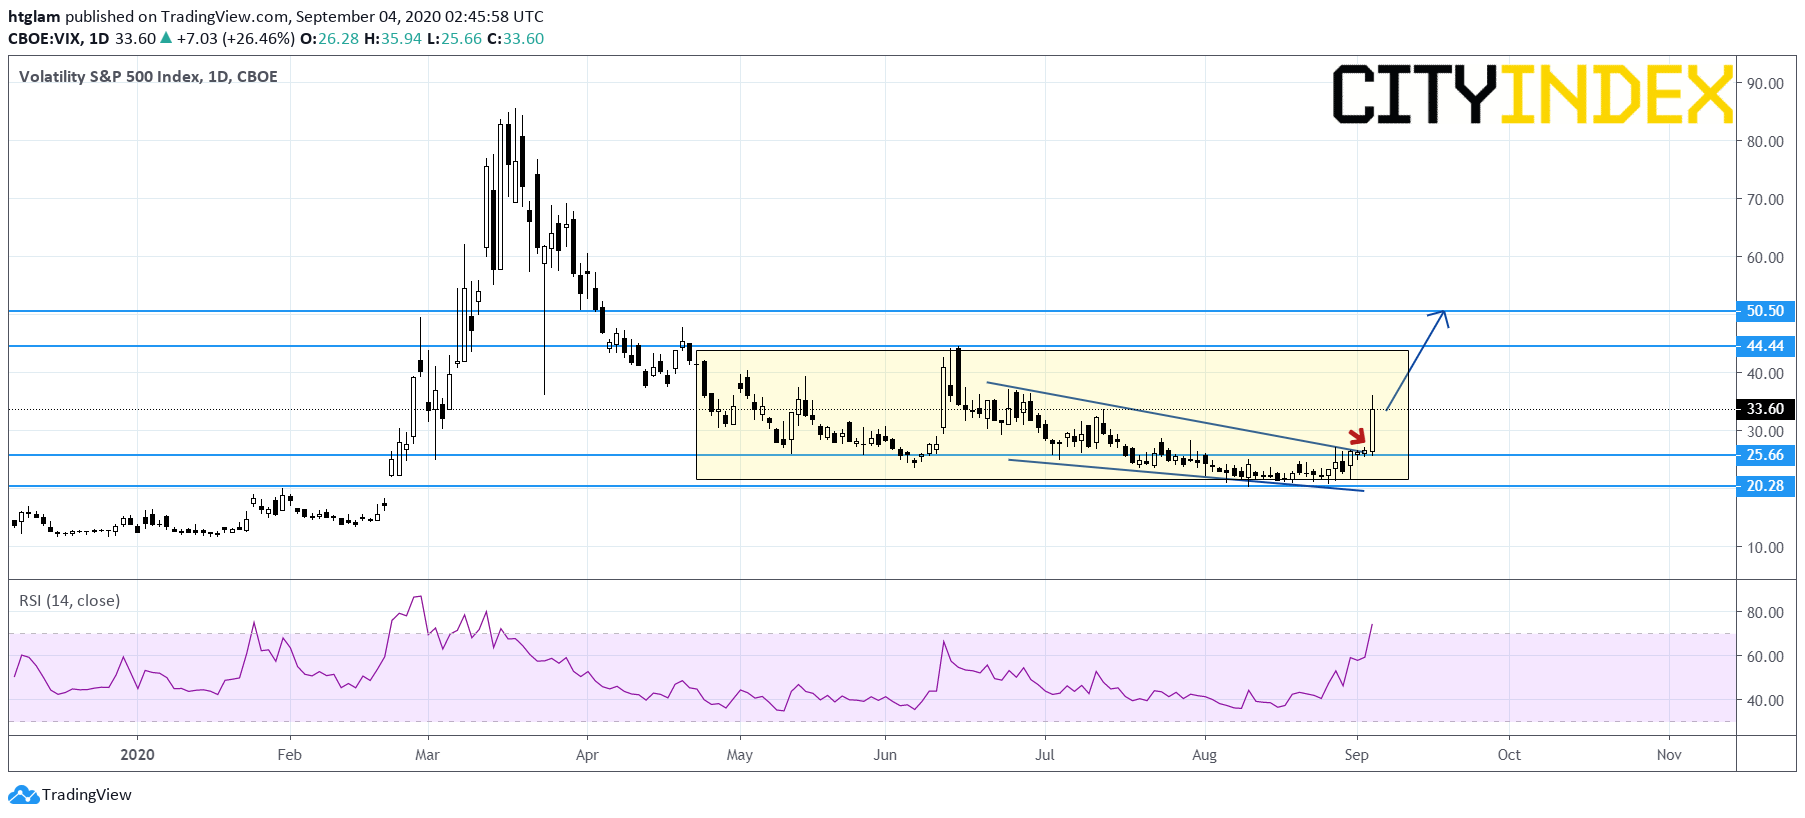
On the daily chart, the VIX Index has accelerated to the upside after breaking above a bullish falling wedge pattern. Nevertheless, it remains within a trading range started from April. The level at 25.66 might be considered as the nearest support, while the 1st and 2nd resistance are expected to be located at 44.44 and 50.50 respectively. Alternatively, a break below 25.66 would signal a loss of upside momentum and may trigger a return to the next support at 20.28.
Source: Gain Capital, TradingView
Let's take a look at the daily chart for stock market.
S&P 500 Index: Remain above February high at 3390
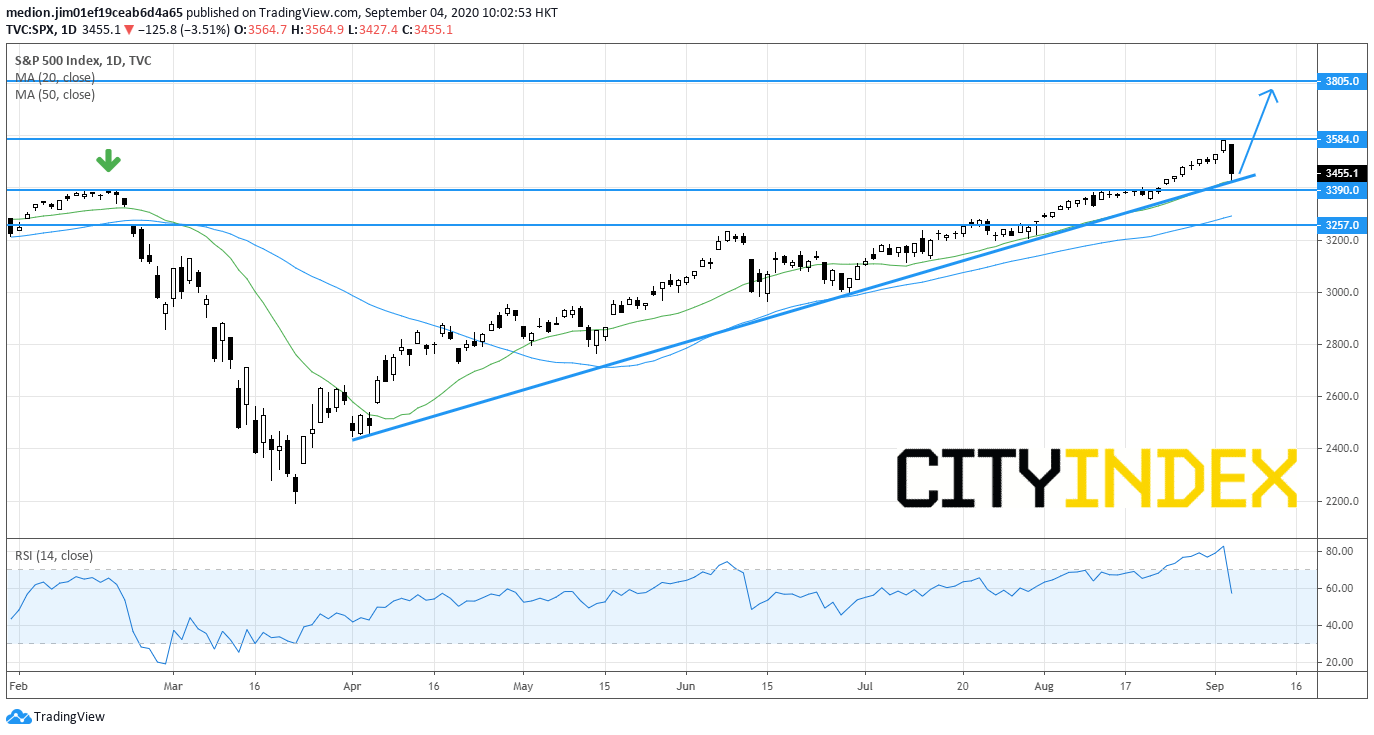
On a daily chart, although the index fell from 3584, it is still supported by a rising trend line drawn from April. In addition, the previous historical high at 3390 remains acting as the support level. As long as this key level is not broken, the index may rebound to 3584 before rising to the next resistance level at 3805. Alternatively, a break below 3390 would trigger a return to 3257.
Source: GAIN Capital, TradingView
The three major indices had climbed more than 30% since March, analysts begin to reassess return prospects and it would not be surprised to see investors taking profit or hedging their position, hence causing a surge in VIX. It might still be too soon to conclude a downturn in equity market's trend.
Meanwhile, the closely watched non-farm payrolls report for August will be released (+1.35 million jobs, jobless rate at 9.8% expected), which may bring volatility to the stock market.
On the daily chart, the VIX Index has accelerated to the upside after breaking above a bullish falling wedge pattern. Nevertheless, it remains within a trading range started from April. The level at 25.66 might be considered as the nearest support, while the 1st and 2nd resistance are expected to be located at 44.44 and 50.50 respectively. Alternatively, a break below 25.66 would signal a loss of upside momentum and may trigger a return to the next support at 20.28.
Source: Gain Capital, TradingView
Let's take a look at the daily chart for stock market.
S&P 500 Index: Remain above February high at 3390
On a daily chart, although the index fell from 3584, it is still supported by a rising trend line drawn from April. In addition, the previous historical high at 3390 remains acting as the support level. As long as this key level is not broken, the index may rebound to 3584 before rising to the next resistance level at 3805. Alternatively, a break below 3390 would trigger a return to 3257.
Source: GAIN Capital, TradingView
On Thursday, U.S. stocks closed sharply lower amid tech shares sell-off. Nasdaq 100 plunged 5.2%, the largest daily decline since March. S&P 500 slumped 3.5% and the Dow Jones Industrial Average lost 2.8%. The VIX Index, a measure of expected volatility based on S&P 500 index options, rallied 26.5% to a 3-month high of 33.60, the biggest jump since June.
The three major indices had climbed more than 30% since March, analysts begin to reassess return prospects and it would not be surprised to see investors taking profit or hedging their position, hence causing a surge in VIX. It might still be too soon to conclude a downturn in equity market's trend.
Meanwhile, the closely watched non-farm payrolls report for August will be released (+1.35 million jobs, jobless rate at 9.8% expected), which may bring volatility to the stock market.
On the daily chart, the VIX Index has accelerated to the upside after breaking above a bullish falling wedge pattern. Nevertheless, it remains within a trading range started from April. The level at 25.66 might be considered as the nearest support, while the 1st and 2nd resistance are expected to be located at 44.44 and 50.50 respectively. Alternatively, a break below 25.66 would signal a loss of upside momentum and may trigger a return to the next support at 20.28.

Source: Gain Capital, TradingView
Let's take a look at the daily chart for stock market.
S&P 500 Index: Remain above February high at 3390
On a daily chart, although the index fell from 3584, it is still supported by a rising trend line drawn from April. In addition, the previous historical high at 3390 remains acting as the support level. As long as this key level is not broken, the index may rebound to 3584 before rising to the next resistance level at 3805. Alternatively, a break below 3390 would trigger a return to 3257.

Source: GAIN Capital, TradingView
The three major indices had climbed more than 30% since March, analysts begin to reassess return prospects and it would not be surprised to see investors taking profit or hedging their position, hence causing a surge in VIX. It might still be too soon to conclude a downturn in equity market's trend.
Meanwhile, the closely watched non-farm payrolls report for August will be released (+1.35 million jobs, jobless rate at 9.8% expected), which may bring volatility to the stock market.
On the daily chart, the VIX Index has accelerated to the upside after breaking above a bullish falling wedge pattern. Nevertheless, it remains within a trading range started from April. The level at 25.66 might be considered as the nearest support, while the 1st and 2nd resistance are expected to be located at 44.44 and 50.50 respectively. Alternatively, a break below 25.66 would signal a loss of upside momentum and may trigger a return to the next support at 20.28.
Source: Gain Capital, TradingView
Let's take a look at the daily chart for stock market.
S&P 500 Index: Remain above February high at 3390
On a daily chart, although the index fell from 3584, it is still supported by a rising trend line drawn from April. In addition, the previous historical high at 3390 remains acting as the support level. As long as this key level is not broken, the index may rebound to 3584 before rising to the next resistance level at 3805. Alternatively, a break below 3390 would trigger a return to 3257.
Source: GAIN Capital, TradingView




The complete CFD trading experience
Award-winning platforms, competitive spreads, low commissions and dedicated support.
We live and breathe the markets and are dedicated to helping traders realise their ambitions as we continue to set the industry bar.
Economic calendar
Web Trader platform
Our sophisticated web-based platform is packed with features.
Related articles

Dow Jones forecast: Stock markets under pressure from multiple sources
When looking at the major tech-heavy US indices like the S&P 500 or the Nasdaq 100, you wouldn’t think that the stock market is particularly weak. Yet, beneath the surface, the market is far from healthy right now. Investors are evidently just piling into the big tech and AI names, and as a result, market breadth is deteriorating. Other indices like the small cap Russell 2000 and the Dow Jones are starting to reflect that weakness.


Nikkei breakout accelerates as yen weakness returns
Nikkei has started October with a powerful breakout, helped by renewed yen weakness and strong upside momentum


S&P 500 Forecast: SPX Continues to Drift Away from Record Highs
Recent trading sessions have done little to restore confidence in the equity market. Over the last four sessions, the S&P 500 has declined by nearly 1.00%, a move that highlights growing short-term weakness and keeps the index moving further away from its record-high territory.

StoneX Europe Ltd may make third party material available on this website which may contain information included but not limited to the conditions of financial markets. The material is for information purposes only and does not contain, and should not be construed as containing, investment advice and/or investment recommendation and/or an investment research and/or an offer of or solicitation for any transactions in financial instruments; any decision to enter into a specific transaction shall be made by the client following an assessment by him/her of their situation.
StoneX Europe Ltd makes no representation or warranty and assumes no liability as to the accuracy or completeness of the information provided, nor any loss arising from any investment based on a recommendation, forecast or other information supplied. You should always seek independent advice as to your suitability to speculate in any related markets and your ability to assume the associated risks, if you are at all unsure. We are not under any obligation to update any such material. Any opinion made may be personal to the author and may not reflect the opinion of StoneX Europe Ltd.