



Weekly COT Report: Bulls Have All but Abandoned the Swiss Franc
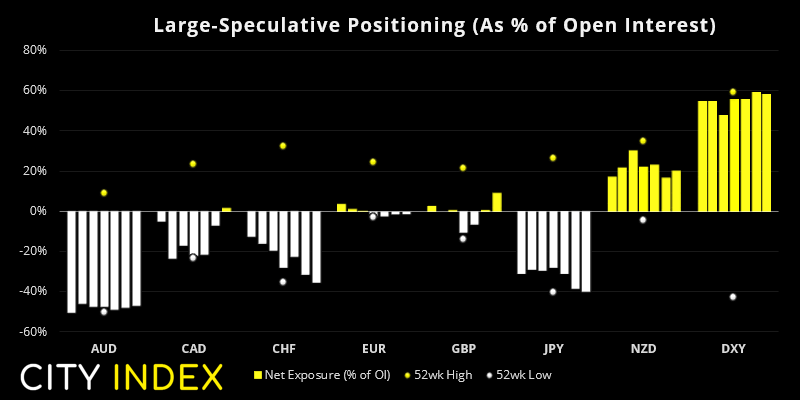
The long / short ratio of bulls to bears on the Swiss franc hit a record low last week, which suggests we may be approaching a sentiment extreme for bearish positioning.
Share this:
Read our guide on how to interpret the weekly COT report
Read our guide on how to interpret the weekly COT report
As of Tuesday 26th October 2021:
- Net-long exposure to the US dollar was trimmed for a third week, according to data compiled by IMM (International Money Market). Traders are estimated to be net-long USD by $19.75 billion, down -$1.7 billion on the week, $19.4 billion of which is against G10 currencies and just $0.3 billion of net-long exposure against emerging currencies.
- Traders flipped to net-long exposure on Canadian dollar futures, breaking an 8-week streak of bearish net exposure
- Bears continued to increase net exposure to CHF and JPY futures
- Short-covering saw net-long exposure to GBP futures rise to a 3-month high
- Net-short exposure to AUD futures were trimmed by just -12 contracts, which is really not a lot considering the Australian dollar rose to a 16-week high and net-exposure is just off from record highs.
CAD futures flip to net-long exposure
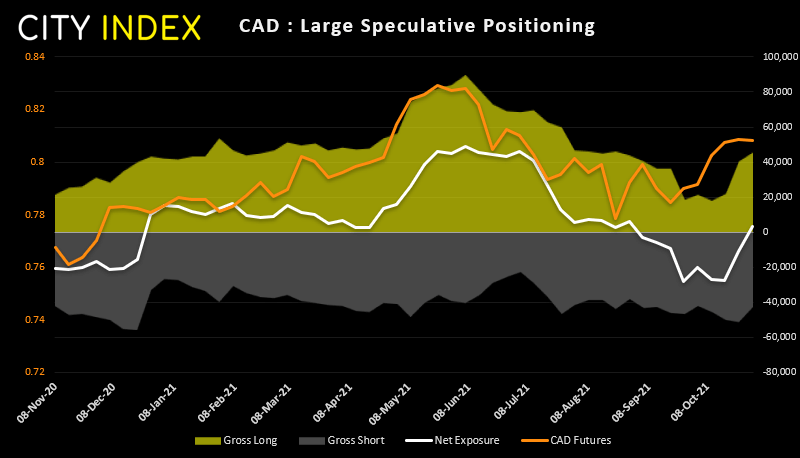
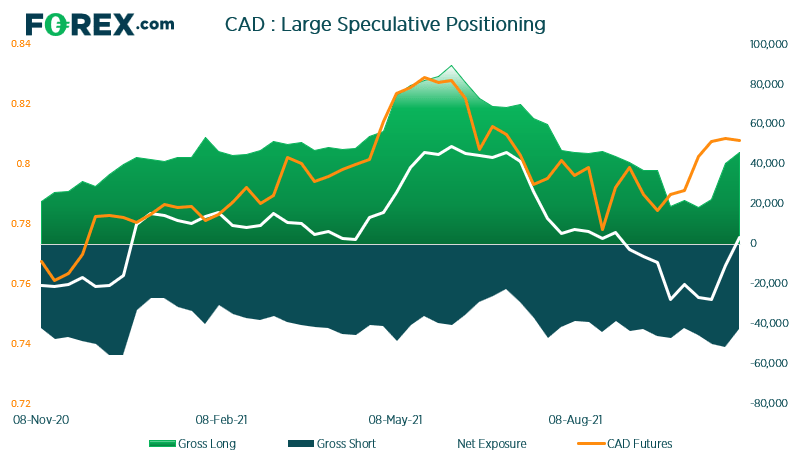
Traders flipped to net-long exposure to CAD futures for the first week in eight. It may only be by 3.3k contracts, but the move was seen with a rise of 5.6k new longs and reduction of -8.6k shorts, which pushed net exposure u by 14.2k contracts to the favour of the bull camp. Given CAD spent around 3-month correcting against its dominant bullish trend, prices do not appear to be stretched to the upside and momentum has now realigned with that bullish trend. So the flip to net-long is simply confirming the trend.
Is the Swiss franc reaching a sentiment extreme?
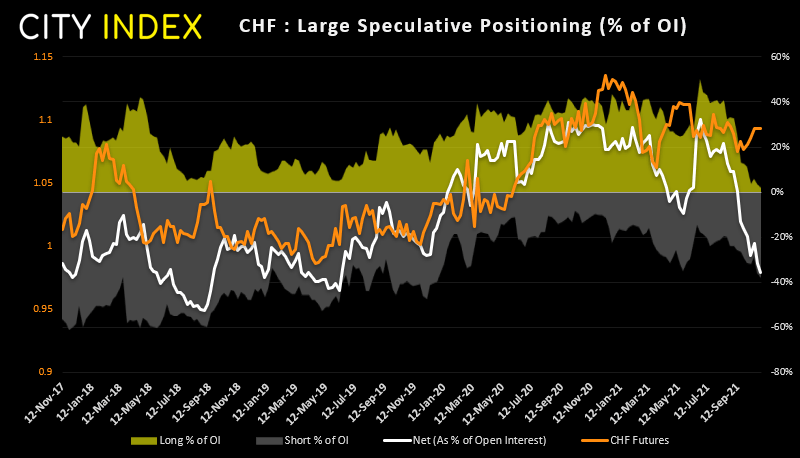
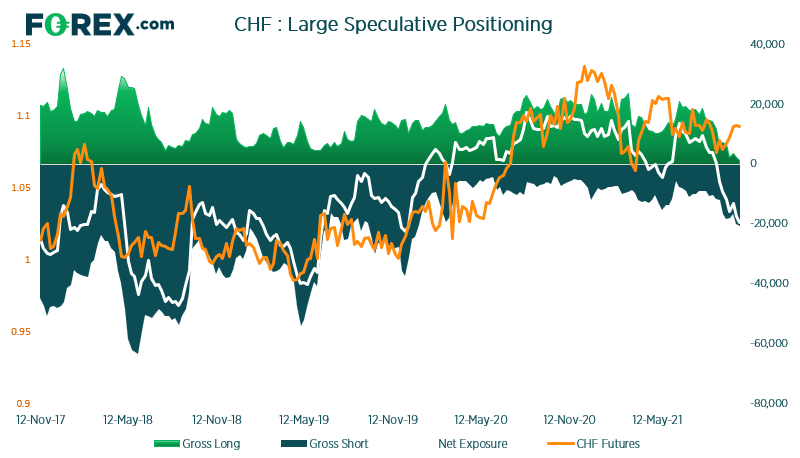
Traders are their most bearish on Swiss franc futures since December 2019. The net exposure indicator has fallen for 10 of the past 11 weeks and gross longs are near a record low. Yet the futures prices rose to an 11-week high. At some point we will either see shorts covered to send prices higher, or prices need to turn lower to justify the current rate of bearish exposure.
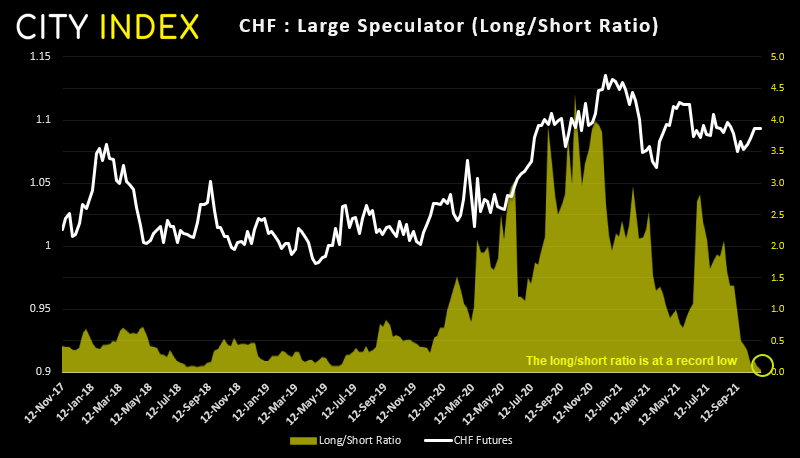
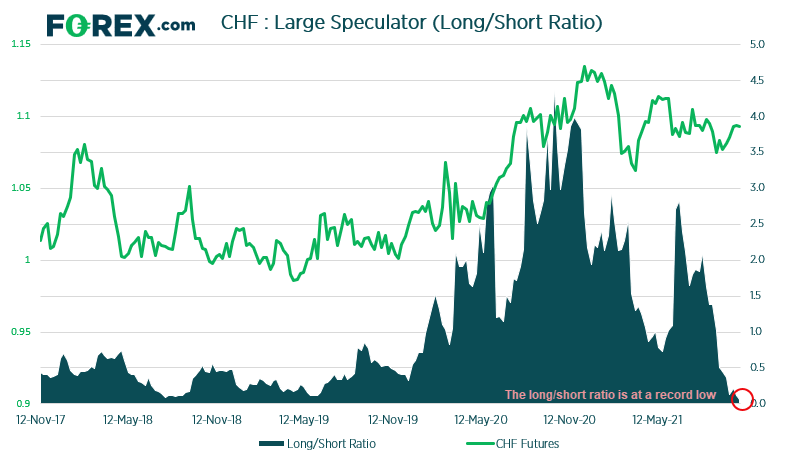
We suspect the former will take place (sentiment extreme to push prices higher) given just 5.7% of traders hold gross long positions, the 1-year Z-score is at -3 standard deviations. But, as always, we need price action to confirm.
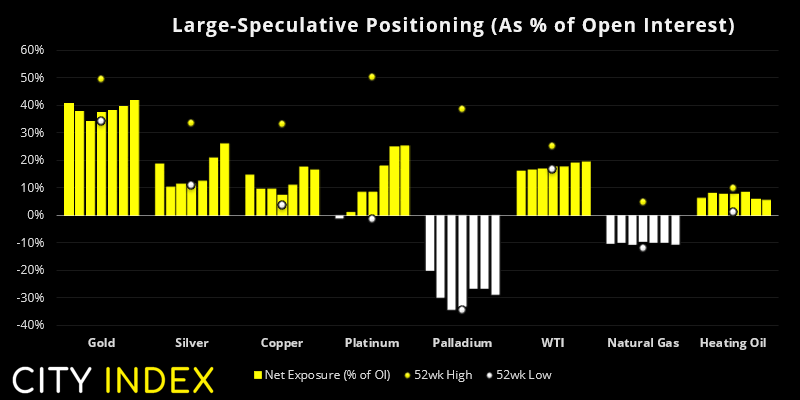
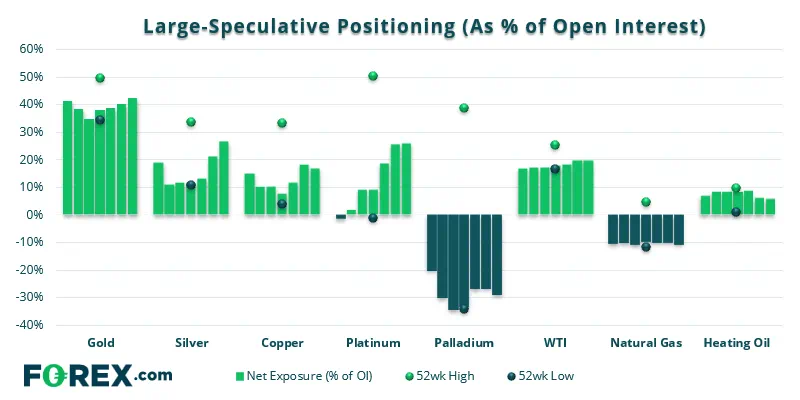
As of Tuesday 26th October 2021:
- Traders increased net-long exposure to gold futures for a fourth week, and are now their most bullish
- Large speculators were their most bullish on silver futures in 14-weeks.
- Traders slightly increased net-long exposure to platinum futures to a 15-week high.
Can silver outperform gold?
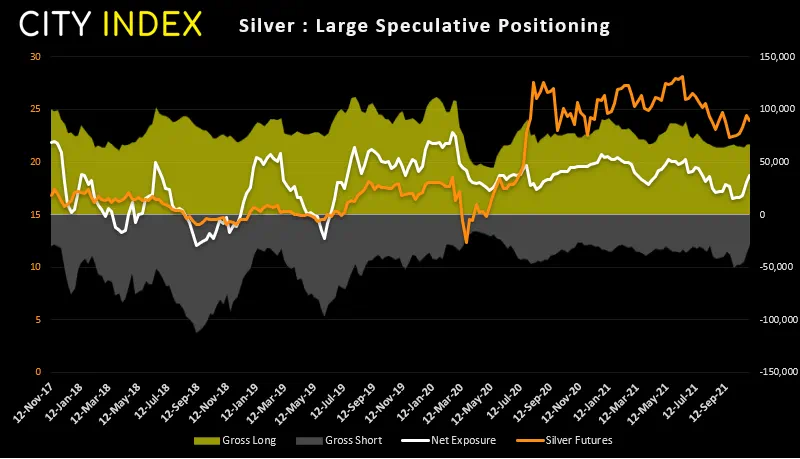
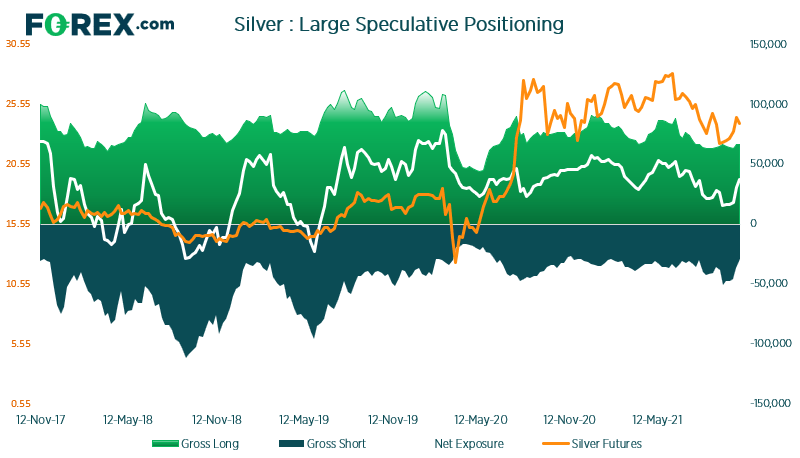
It is certainly a scenario to consider, given the rise of bullish interest on silver futures. Traders are now their most bullish on silver in 14-weeks, although as of yet its rally has been a function of short-covering. Therefore, we now want to see fresh longs initiated to provide the rally with some additional strength. However, both gold and silver are retracing against their trends so one way to monitor the relationship is to see which has the shallowest correction to reveal the stronger market for when or if bulls return.
How to trade with City Index
You can trade easily trade with City Index by using these four easy steps:
- Open an account, or log in if you’re already a customer
• Open an account in the UK
• Open an account in Australia
• Open an account in Singapore
- Search for the company you want to trade in our award-winning platform
- Choose your position and size, and your stop and limit levels
- Place the trade
How to trade with FOREX.com
Follow these easy steps to start trading with FOREX.com today:
- Open a Forex.com account, or log in if you’re already a customer.
- Search for the pair you want to trade in our award-winning platform.
- Choose your position and size, and your stop and limit levels.
- Place the trade.


The complete CFD trading experience
Award-winning platforms, competitive spreads, low commissions and dedicated support.
We live and breathe the markets and are dedicated to helping traders realise their ambitions as we continue to set the industry bar.
Economic calendar
Web Trader platform
Our sophisticated web-based platform is packed with features.
Related articles
Nikkei swings harder than Nasdaq as AI fears deepen
Nikkei 225 volatility is running well ahead of Nasdaq 100, with the index construction and Japan's heavy exposure to AI manufacturing potentially explaining the difference.

Forex & Gold Outlook: Dollar Dominates, Crosses Diverge
The US dollar rally gathers momentum as forex crosses develop contrasting technical setups. Matt Simpson examines eight FX markets and gold for potential trading opportunities.

Gold Outlook: Asia Buys the Dip, US Hammers the Rip
Asia buys the dip, the US sells the rip. Hourly gold, dollar and Treasury yield data reveal a regional divide that has become especially pronounced since September.
StoneX Europe Ltd may make third party material available on this website which may contain information included but not limited to the conditions of financial markets. The material is for information purposes only and does not contain, and should not be construed as containing, investment advice and/or investment recommendation and/or an investment research and/or an offer of or solicitation for any transactions in financial instruments; any decision to enter into a specific transaction shall be made by the client following an assessment by him/her of their situation.
StoneX Europe Ltd makes no representation or warranty and assumes no liability as to the accuracy or completeness of the information provided, nor any loss arising from any investment based on a recommendation, forecast or other information supplied. You should always seek independent advice as to your suitability to speculate in any related markets and your ability to assume the associated risks, if you are at all unsure. We are not under any obligation to update any such material. Any opinion made may be personal to the author and may not reflect the opinion of StoneX Europe Ltd.