







WTI Crude Oil Analysis: Bears Eye Another Assault on $60
Conflicting signals form the COT futures report make the outlook for oil a bit murkier than I'd like. But over the near term, price action suggests WTI crude oil could be facing another attempt at breaking below $60.
Share this:

View related analysis:
- Crude Oil Forecast: Short Covering and WTI Spread Hint at Bounce
- S&P/ASX 200, Hang Seng Analysis: Price Action Setups
- USD/JPY, USD/CHF Rise for 2nd Day, Market Forces Lend SNB a Hand
- Tentative Signs of a US Dollar Rebound Ahead of Powell speech
View related analysis:
- Crude Oil Forecast: Short Covering and WTI Spread Hint at Bounce
- S&P/ASX 200, Hang Seng Analysis: Price Action Setups
- USD/JPY, USD/CHF Rise for 2nd Day, Market Forces Lend SNB a Hand
- Tentative Signs of a US Dollar Rebound Ahead of Powell speech
WTI Crude Oil Futures (CL) market Positioning – COT Report
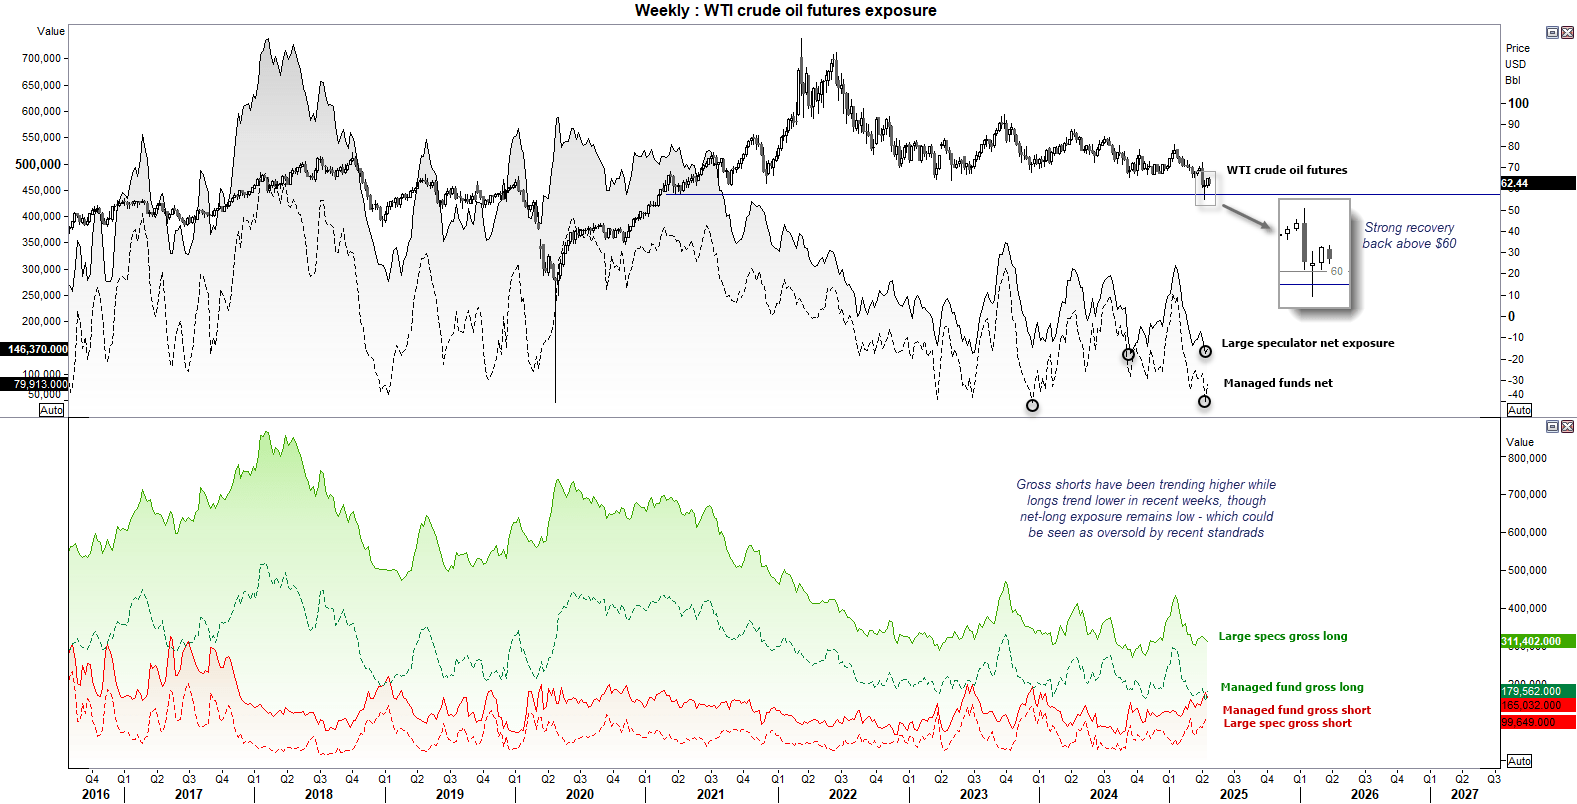
There are a few competing forces visible in the CME positioning data, which makes WTI’s next big move harder to decipher. While gross shorts have been trending higher in recent weeks while gross longs fell, net-long exposure is arguably oversold among traders who a predominantly always net long.
However, given the strong false break of $60 two weeks ago, I suspect prices will hold above $60 and drift up towards $70. But price action on the near term suggests bears want another crack at $60 first.
- Gross short exposure among managed funds and large speculators has been trending slightly higher overall in recent weeks, though both sets of traders reduced short exposure last week (by a combined total of -13k contracts).
- Gross longs have also been falling in recent weeks, though managed funds increased net-long exposure to WTI crude oil by 24k contracts.
- Two weeks ago, large speculators were at their least bullish on WTI crude oil futures since December, while managed funds were at their least bullish since September 2023.
- From this metric, bullish exposure could be seen as oversold, even if short positioning has been rising overall in recent weeks.
WTI Crude Oil Technical Analysis: Daily Chart
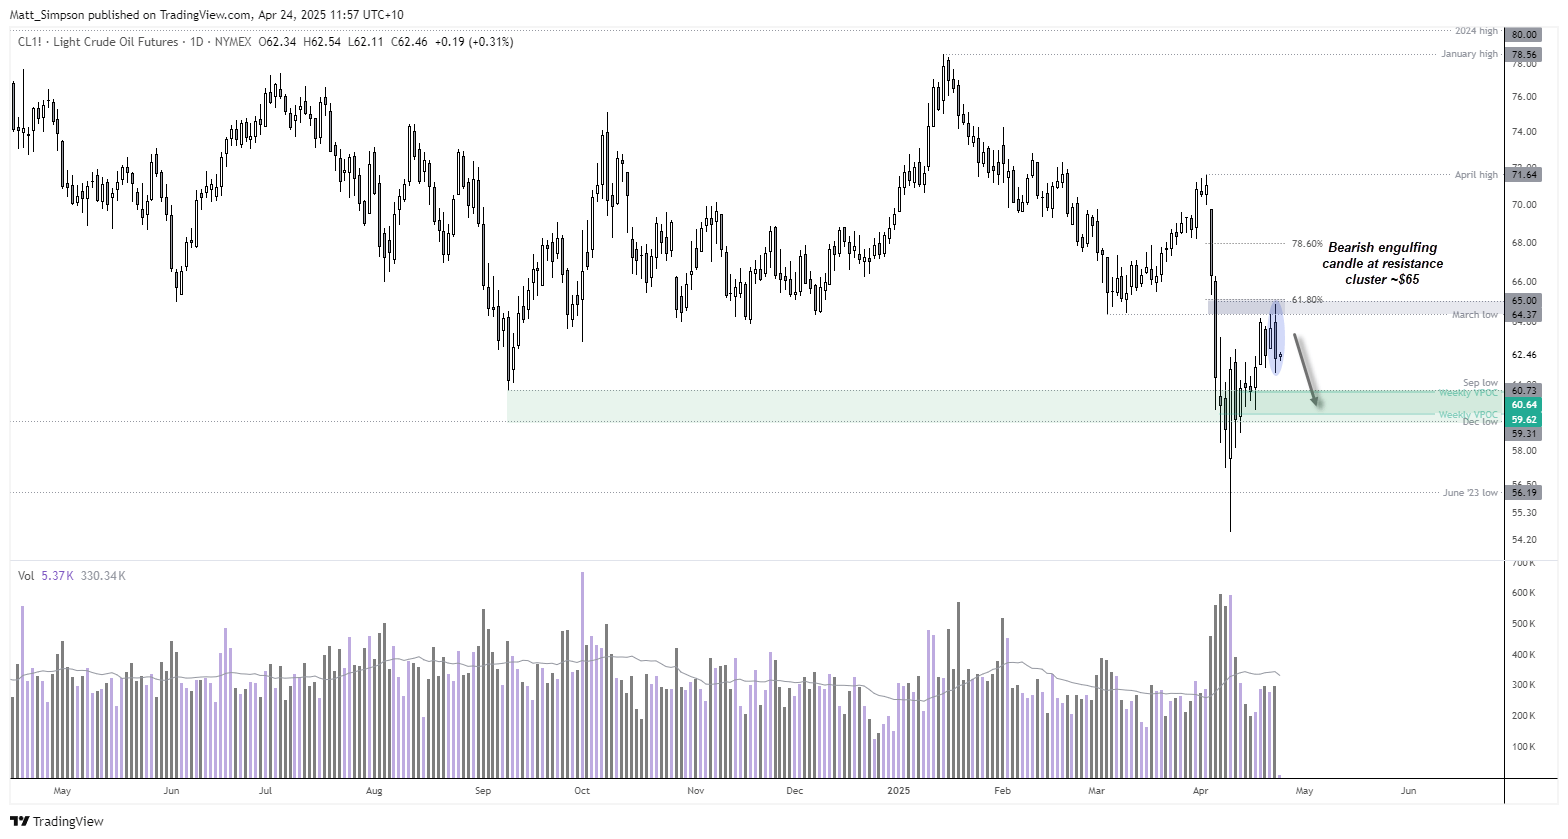
The sharp decline from the April high marks the second leg lower since crude oil topped out in January. However, the momentum during the second leg was notably stronger.
Subsequent price action has been volatile, and while prices have moved higher, bulls have made hard work of those gains. The overlapping nature of the daily candles could suggest this ‘rebound’ is corrective, especially as volumes are also lower.
A bearish outside/engulfing candle formed on Wednesday around $65, near a 61.8% Fibonacci retracement and the March low. The bias now is for at least a move down to $60, though note potential VPOC support levels at $59.62 and $60.64.
WTI Crude Oil Technical Analysis: 1-Hour Chart
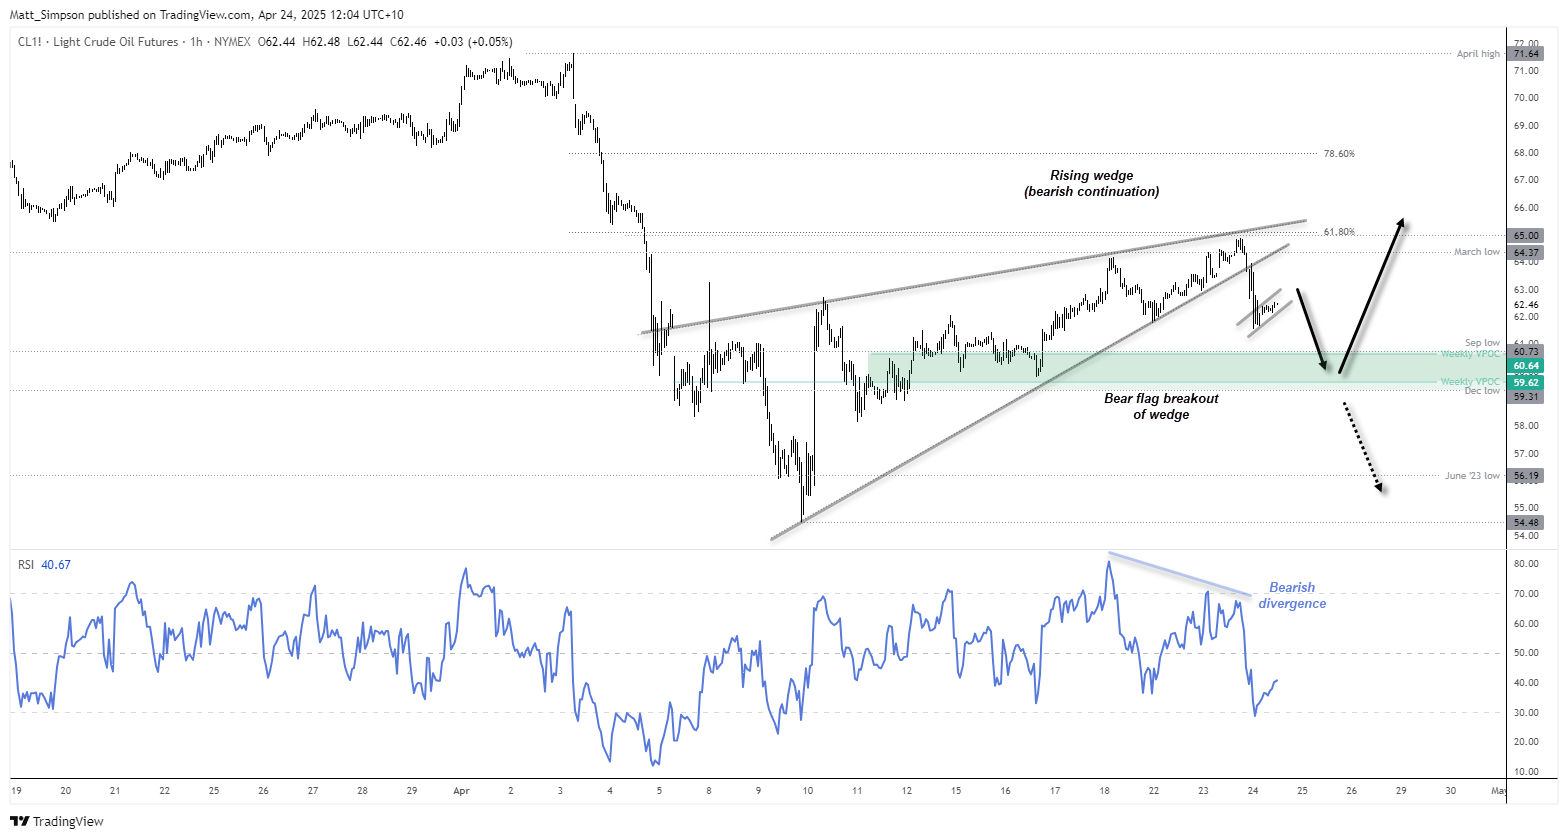
The 1-hour chart shows crude oil prices have broken down from a rising wedge pattern. Such patterns can act as continuation patterns during a downtrend and generate bearish price objectives near the base – which in this case is around $54.50.
A bearish divergence also formed before momentum turned lower. Price action on the 1-hour chart also reveals a smaller flag pattern projecting a downside target just below $60.
While my bias remains for a move to $60, be on guard for volatility around this milestone level.
-- Written by Matt Simpson
Follow Matt on Twitter @cLeverEdge
How to trade with City Index
You can trade with City Index by following these four easy steps:
- Open an account, or log in if you’re already a customer
• Open an account in the UK
• Open an account in Australia
• Open an account in Singapore
- Search for the market you want to trade in our award-winning platform
- Choose your position and size, and your stop and limit levels
- Place the trade
Related tags:
Latest market news




The complete CFD trading experience
Award-winning platforms, competitive spreads, low commissions and dedicated support.
We live and breathe the markets and are dedicated to helping traders realise their ambitions as we continue to set the industry bar.
Economic calendar
Web Trader platform
Our sophisticated web-based platform is packed with features.
Related articles
EUR/USD weekly outlook: FOMC and ECB to set the tone
The current backdrop is modestly bearish. On Friday, the EUR/USD closed modestly lower, down for the third consecutive day. The pair also posted a weekly decline after staging a modest recovery attempt in the previous week. Out of the past 8 weeks, the EUR/USD has fallen on 6 occasions. There is not much supporting factors for the single currency right now. So, the upside remains capped.


Silver forecast: metals liquidation drags XAG/USD into $50-55 support
Silver has broken its July low and slipped into a long-term support zone as the selling in precious metals deepens. The chart shows where the metal could bottom, and next week's Fed decision may decide whether it does.

Crude Oil Forecast: Weekend Iran Strike Fears Lift Oil Toward War Highs
Brent crude oil is accelerating above $110 as traders price in the risk of a US-Israeli strike on Iran over the weekend. How much more of a geopolitical premium can oil build in before the close?

StoneX Europe Ltd may make third party material available on this website which may contain information included but not limited to the conditions of financial markets. The material is for information purposes only and does not contain, and should not be construed as containing, investment advice and/or investment recommendation and/or an investment research and/or an offer of or solicitation for any transactions in financial instruments; any decision to enter into a specific transaction shall be made by the client following an assessment by him/her of their situation.
StoneX Europe Ltd makes no representation or warranty and assumes no liability as to the accuracy or completeness of the information provided, nor any loss arising from any investment based on a recommendation, forecast or other information supplied. You should always seek independent advice as to your suitability to speculate in any related markets and your ability to assume the associated risks, if you are at all unsure. We are not under any obligation to update any such material. Any opinion made may be personal to the author and may not reflect the opinion of StoneX Europe Ltd.