



WTI crude oil and natural gas fan fears of another round of inflation
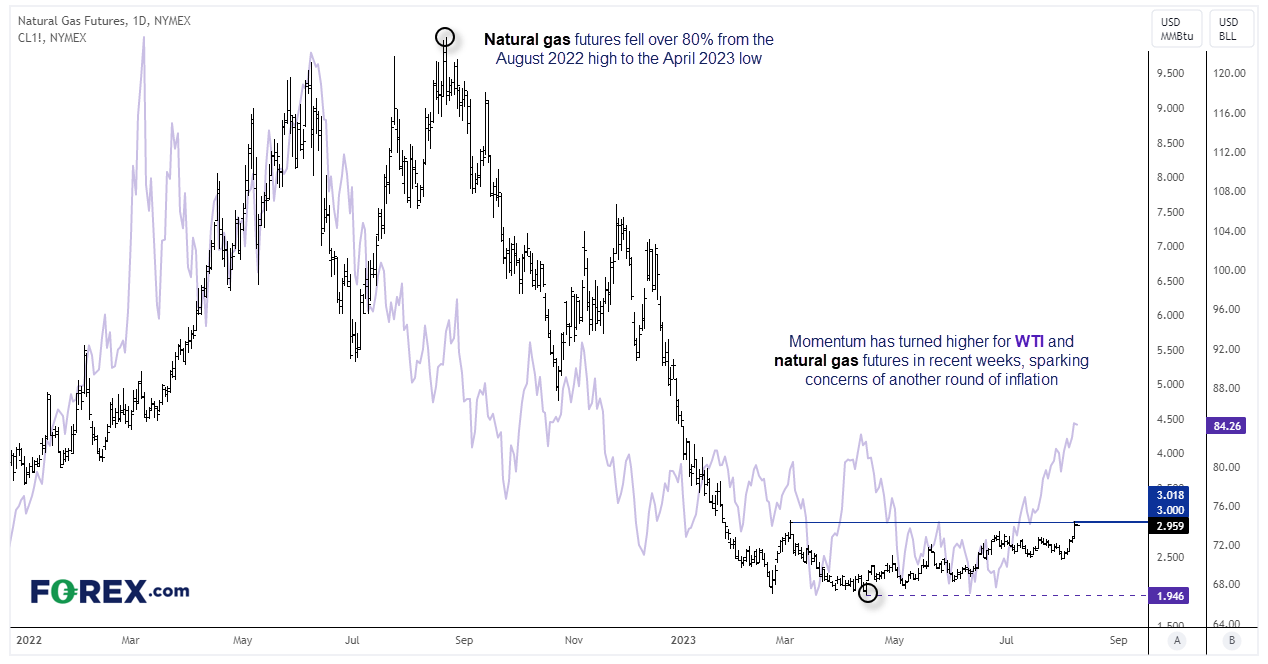
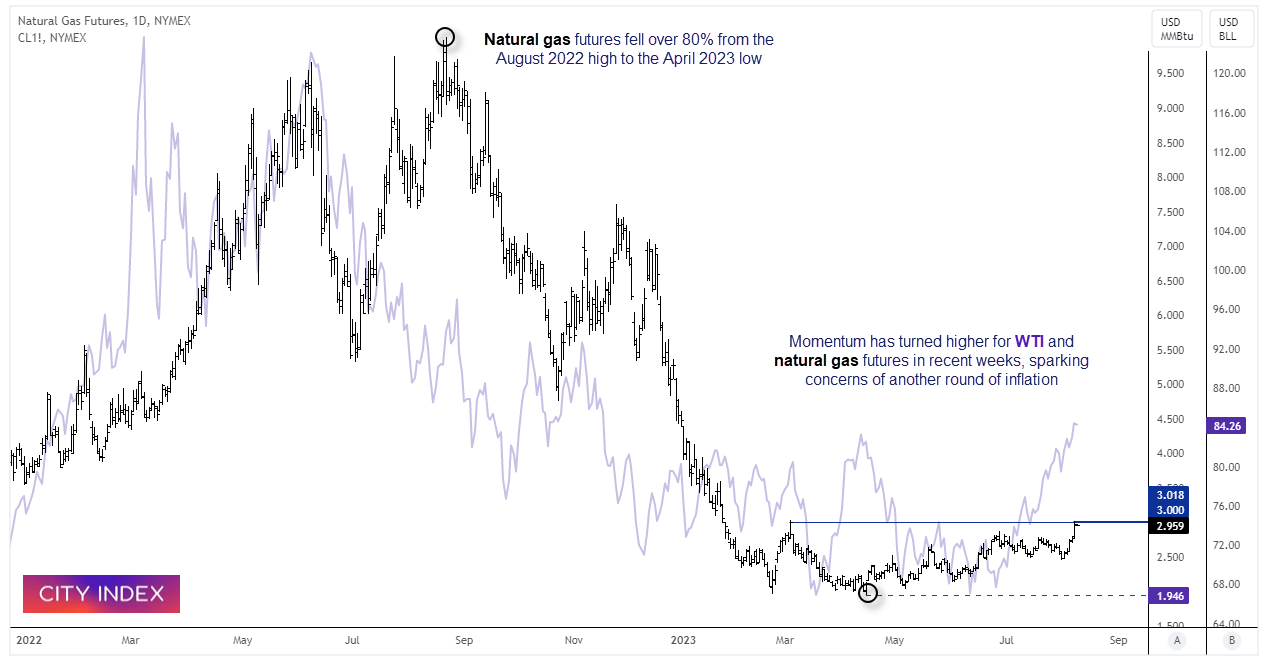
Natural gas – a key inflationary input – is teasing markets with a bullish breakout on the eve of a key US inflation report in the US. A day after WTI hit a new YTD high.
Share this:

The United States is set to release a key inflation report later today, and the figures could have a significant impact on the Federal Reserve's decision on whether to raise interest rates in September. The rise of key energy markets such as WTI crude oil and natural gas has many investors concerned that we are headed for another round of inflation, which could lead to higher interest rates for a longer period of time or even more rate hikes from the central bank. WTI crude oil made headlines yesterday for finally breaking to a new year-to-date high, and it is now at its most bullish level since November 2022.
WTI 4-hour chart:
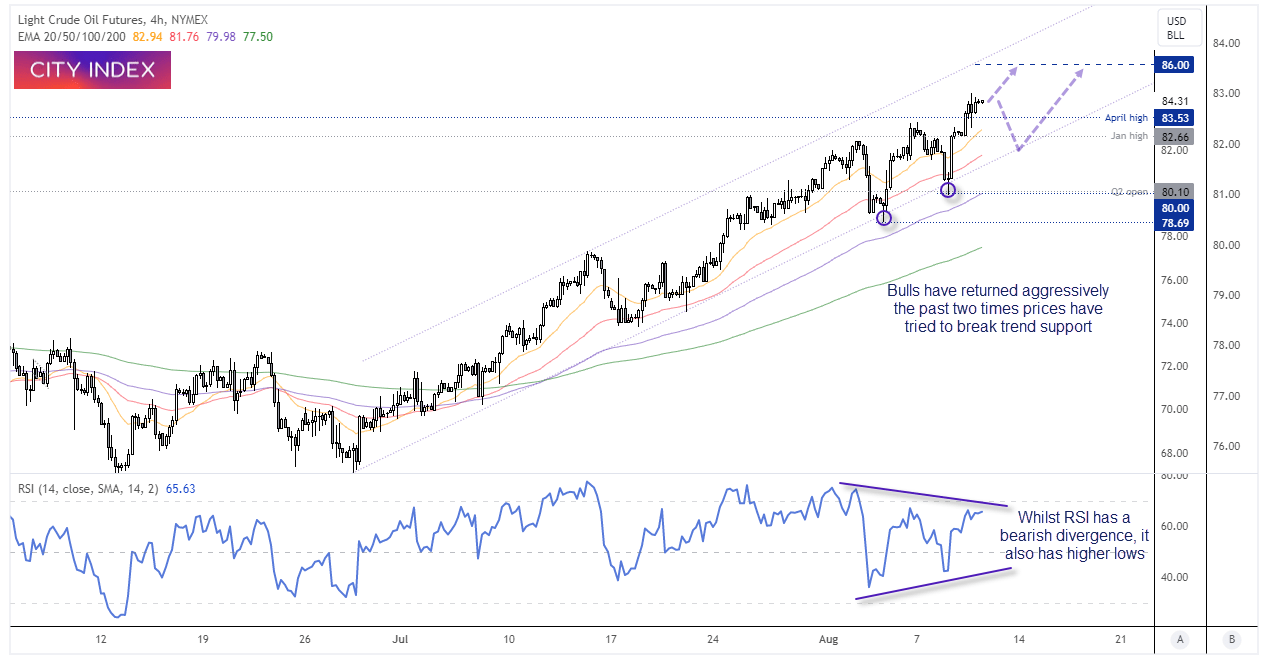
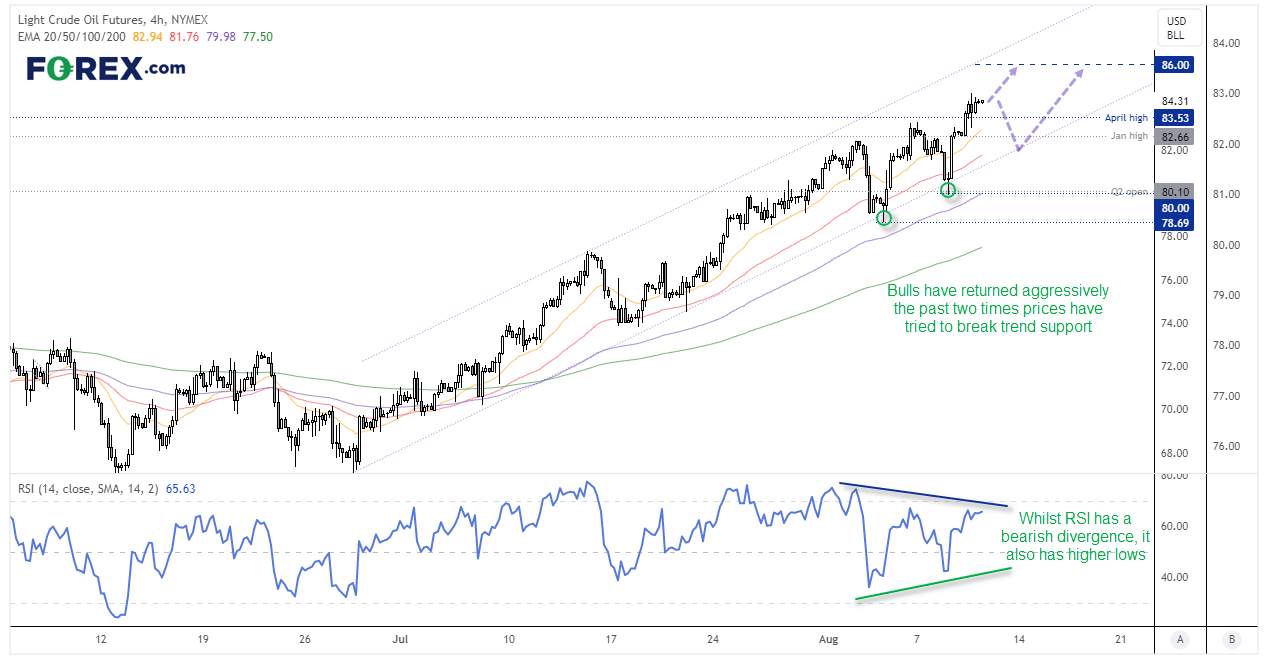
We noted in our weekly COT report that managed funds and large speculators has been reducing short exposure to WTI crude oil and increasing longs, which is the ideal scenario for a healthy bullish trend. WTI has now increased by over 26% over the past seven weeks, and on track for close higher for its seventh week – a bullish streak not seen since the 8-week rally in February 2022.
We can see on the 4-hour chart that WTI crude oil is trading within an established bullish channel. It is consolidating in a tight range near its 9-month highs ahead of today’s inflation report, and a hot print could knock it from its perch. And given it only closed above its previous YTD high by less than $1, a pullback beneath the April high seems plausible – especially as a bearish divergence is forming on the RSI (14).
However, each time WTI has pulled back towards trend support, buyers have stepped in to push it aggressively to a new high. Therefore, we’ll be on the lookout for evidence of a swing low if prices retrace towards $82 / lower trendline. But if US inflation data is weaker than expected, we could see WTI continuing higher in line with its bullish trend.
Is natural gas set to breakout?
Natural gas is a key component in the energy markets due to its versatility and wide range of uses, including electricity generation, industrial processes, heating, and cooking. It began making major headlines around 18 months ago when natural gas prices embarked on a parabolic rise, with Russia's invasion of Ukraine being a key factor. However, the front-month US natural gas futures contract fell by over 80% between August 2022 and April this year, leading many to believe that prices would eventually revert higher. And now, it appears that we have reached that point.
A combination of factors has seen momentum turn higher in the past few weeks, such as reduced LNG exports and hotter-than-usual weather forecasts. Meteorologists forecast that hotter-than-usual weather will persist until at least August 24, prompting investors to anticipate higher consumption of natural gas for air conditioning. Texas, in particular, is set to witness another record-breaking power demand this week, following its all-time high on Monday.
Whilst there has been an increase in production since July, it has not been enough to offset increased demand from power generation and air conditioning. As a result of these factors, natural gas prices have risen to their highest level in five months. It is possible that prices could continue to rise if the hot weather persists and if LNG exports remain constrained. Furthermore, even if weather and demand is to cool seasonality suggests upside pressures around this time of year through to November or December.
Seasonality favours gains for natural gas
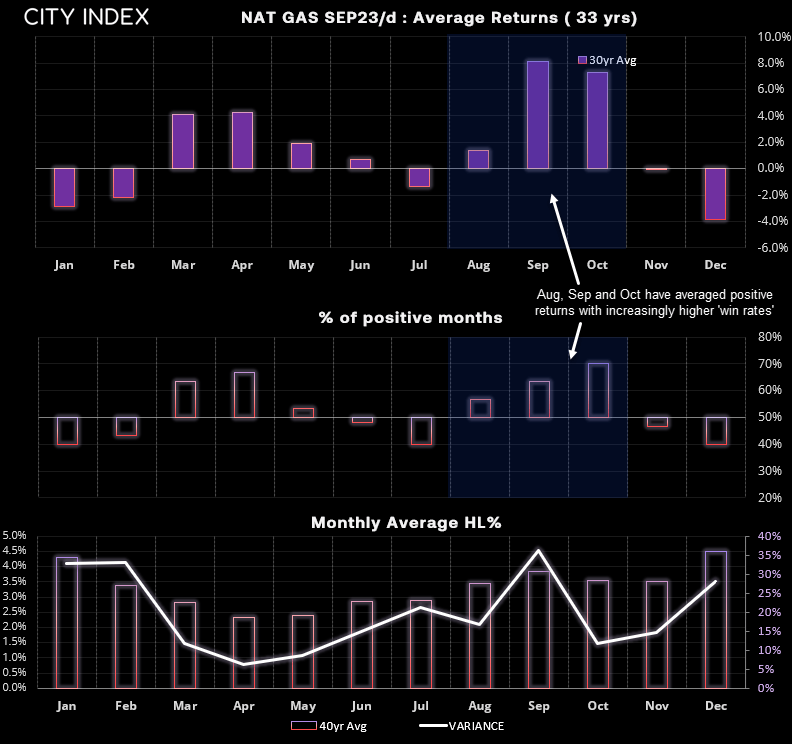
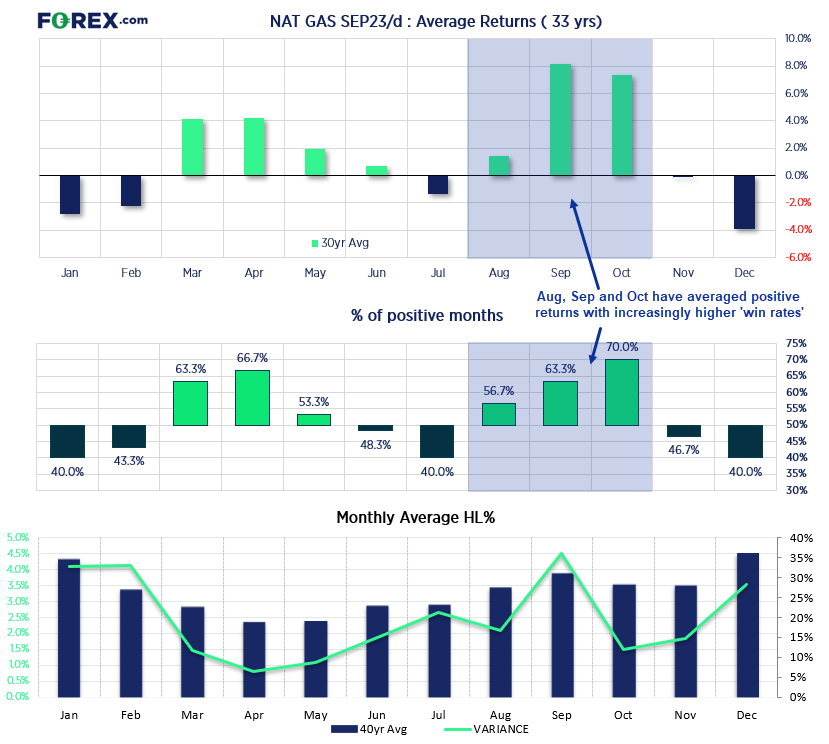
Natural gas has had a history of producing average positive returns in August, September, and October over the past 33 years. Specifically, August has averaged a 2.8% return with a 56.7% win rate, September has averaged 9.6% gains on average with a 63.3% win rate, and October has averaged a 7.2% average return with a 70% win rate. This is significant because it suggests that natural gas prices may continue to rise in these months, which could contribute to a second round of inflation. This is especially concerning given that oil prices are also rising and have recently hit a new high.
Natural gas daily chart:
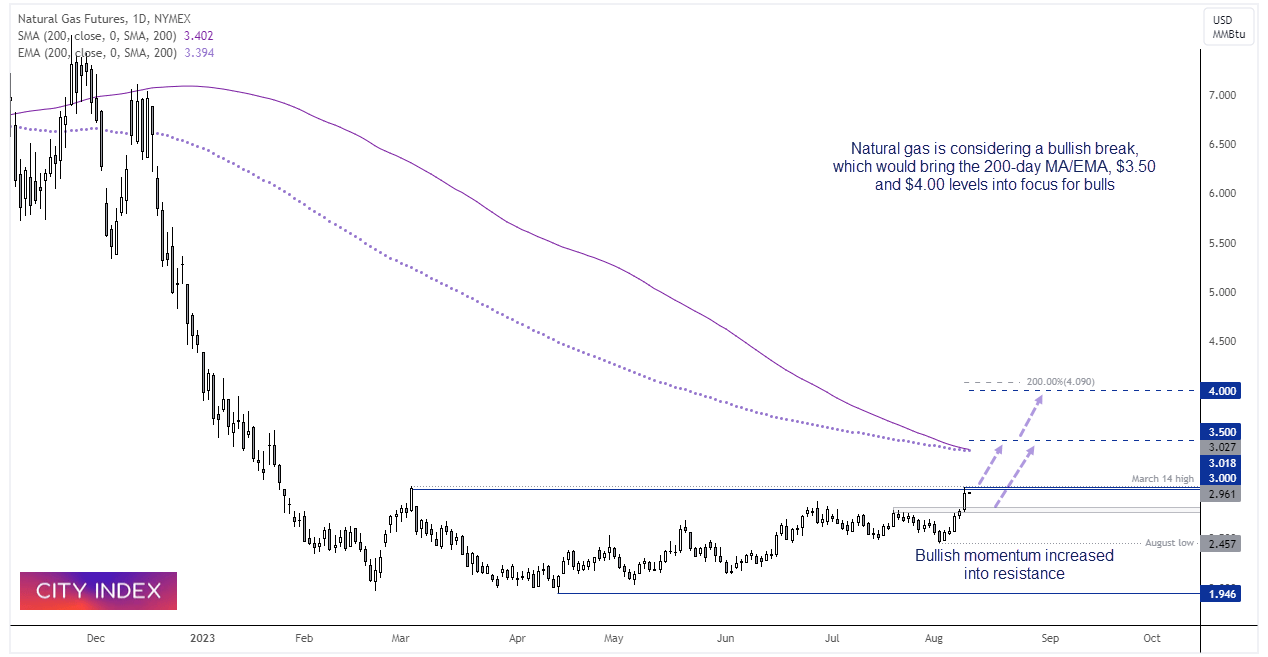
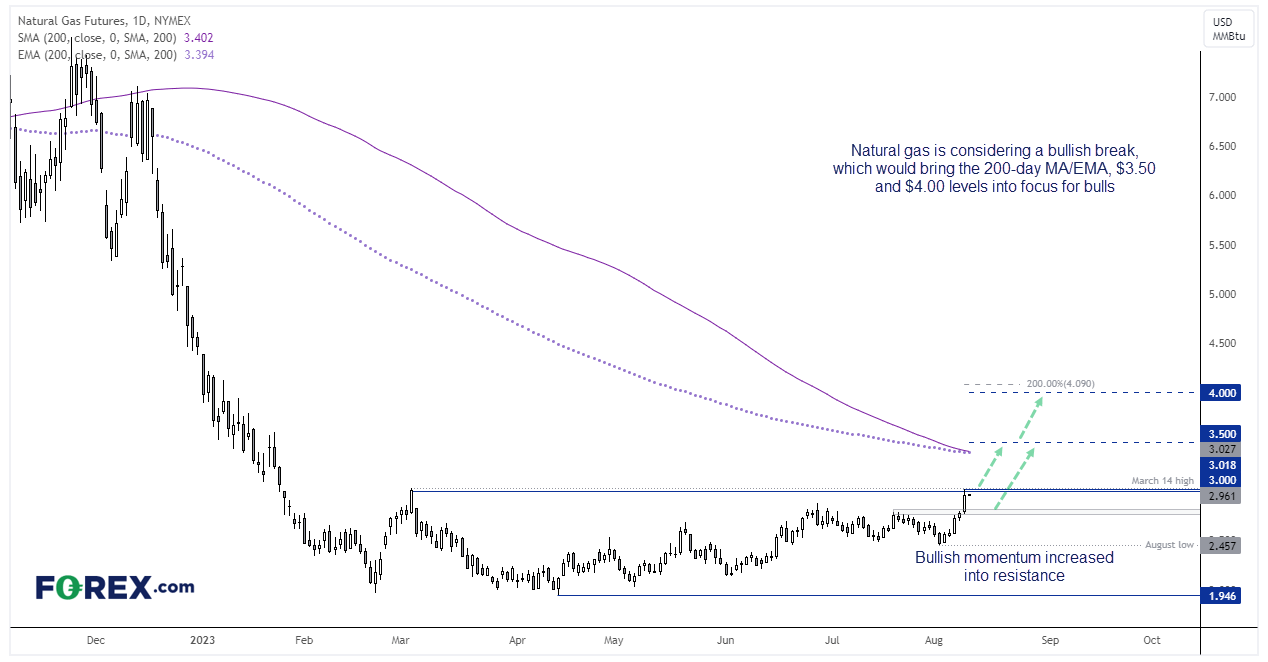
We can see on the daily chart that a strong bullish trend is emerging, within bullish momentum increasing into the highs. The sideways range between the March high and April low projects a target around 4.09, but we can use the round number of $4.00.
However, the 200-day MA and 200-day EMA sit just below $3.50 which makes it a likely resistance level. From here, bulls could consider entering long with a break above the March high ($3.02) with a stop beneath Wednesday’s low, and target the 200-day averages around $3.40 or $3.50. If prices pull bac and form a higher low above $3.00, bulls could raise their stop and consider another move to $4.00.
If the breakout does not occur soon, bulls could seek evidence of a swig low above $2.70, and enter long in anticipation of an eventual bullish breakout and target the levels $3.40, $3.50 and $4.00.
-- Written by Matt Simpson
Follow Matt on Twitter @cLeverEdge
How to trade with City Index
You can trade with City Index by following these four easy steps:
- Open an account, or log in if you’re already a customer
• Open an account in the UK
• Open an account in Australia
• Open an account in Singapore
- Search for the market you want to trade in our award-winning platform
- Choose your position and size, and your stop and limit levels
- Place the trade
Related tags:



The complete CFD trading experience
Award-winning platforms, competitive spreads, low commissions and dedicated support.
We live and breathe the markets and are dedicated to helping traders realise their ambitions as we continue to set the industry bar.
Economic calendar
Web Trader platform
Our sophisticated web-based platform is packed with features.
Related articles
EUR/USD forecast remains tilted lower with French bond troubles ahead of US jobs report
The EUR/USD has tagged a fresh year-to-date low as French public-finance concerns trigger a government bond sell-off. Today's US jobs report may change little, with resilient activity, elevated energy prices and hawkish Fed bets keeping the greenback supported. With the pair trapped below resistance at 1.1410, the risk to the near-term EUR/USD forecast is tilted to the downside.

USD/CAD shooting star puts September surge on notice
USD/CAD has printed a clear bearish reversal pattern after an extraordinary September surge, but confirmation may depend heavily on how US Treasury yields react to Friday’s payrolls report.


Gold Price Forecast: XAU/USD Plunges 12.4% Toward Critical Support 10 1 2026
Softer inflation has revived expectations for a Fed pause, but Friday’s payrolls could put gold’s recovery prospects to the test.

StoneX Europe Ltd may make third party material available on this website which may contain information included but not limited to the conditions of financial markets. The material is for information purposes only and does not contain, and should not be construed as containing, investment advice and/or investment recommendation and/or an investment research and/or an offer of or solicitation for any transactions in financial instruments; any decision to enter into a specific transaction shall be made by the client following an assessment by him/her of their situation.
StoneX Europe Ltd makes no representation or warranty and assumes no liability as to the accuracy or completeness of the information provided, nor any loss arising from any investment based on a recommendation, forecast or other information supplied. You should always seek independent advice as to your suitability to speculate in any related markets and your ability to assume the associated risks, if you are at all unsure. We are not under any obligation to update any such material. Any opinion made may be personal to the author and may not reflect the opinion of StoneX Europe Ltd.