



WTI crude oil prices defy the bullish consensus
The 4-month winning streak on oil prices is on track to be snapped, with October having erased all of September’s gains. And this flies in the face of current news flows, of the potential for the Middle East conflict to escalate and send oil prices higher (alongside food, energy and inflation expectations).
Share this:

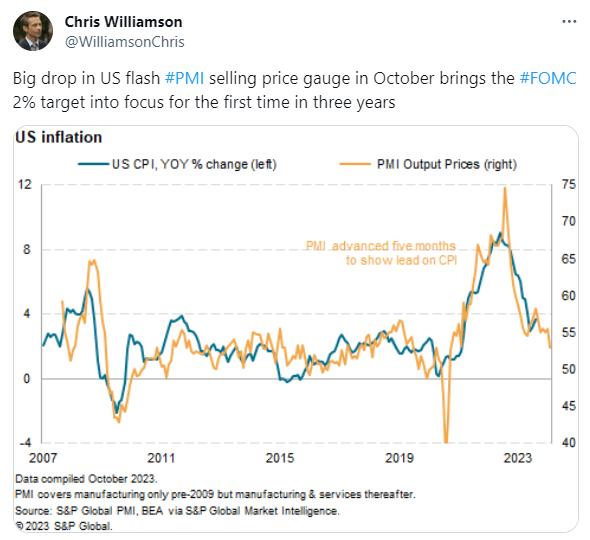
PMI data for the US was better than expected, which helped the US dollar index rally from a key support area on Tuesday and weigh on oil prices. The S&P Global report suggests the economy expanded at its fastest pace in three months with flash composite PMI rise to 51, up from 50.2. Services PMI accounted to the baulk of the rise with its flash PMI rising to 50.9, above 49.8 expected and 50.1 prior.
Whilst this could initially be seen as slightly inflationary which could add pressure on the Fed to hike at least once more, price pressures are easing which could actually lower the need for further hikes. If prices pressures are easing, it could also weigh on headline CPI and inflation expectations. And that could also be bearish for oil prices. And this flies in the face of current news flows, with the potential for the Middle East conflict to escalate and send oil prices higher (alongside food, energy and inflation expectations).
S&P Global’s Chief economist thinks that inflation could reach the Fed’s 2% inflation target “in the coming months” without the economy tipping into contraction. If so, it means inflation pressures are falling faster than anticipated and that the US could avoid a recession. Whilst this is supportive to oil prices to a degree (on the assumption on greater demand than a recession would usually bring), it could also cap upside potential and pour cold water on calls for oil in excess of $100. Assuming World War III is avoided.
S&P Global’s Chief Business Economist “The survey’s selling price gauge is now close to its prepandemic long-run average and consistent with headline inflation dropping close to the Fed’s 2% target in the coming months, something which looks likely to be achieved without output falling into contraction”.
WTI crude oil technical analysis (weekly chart)
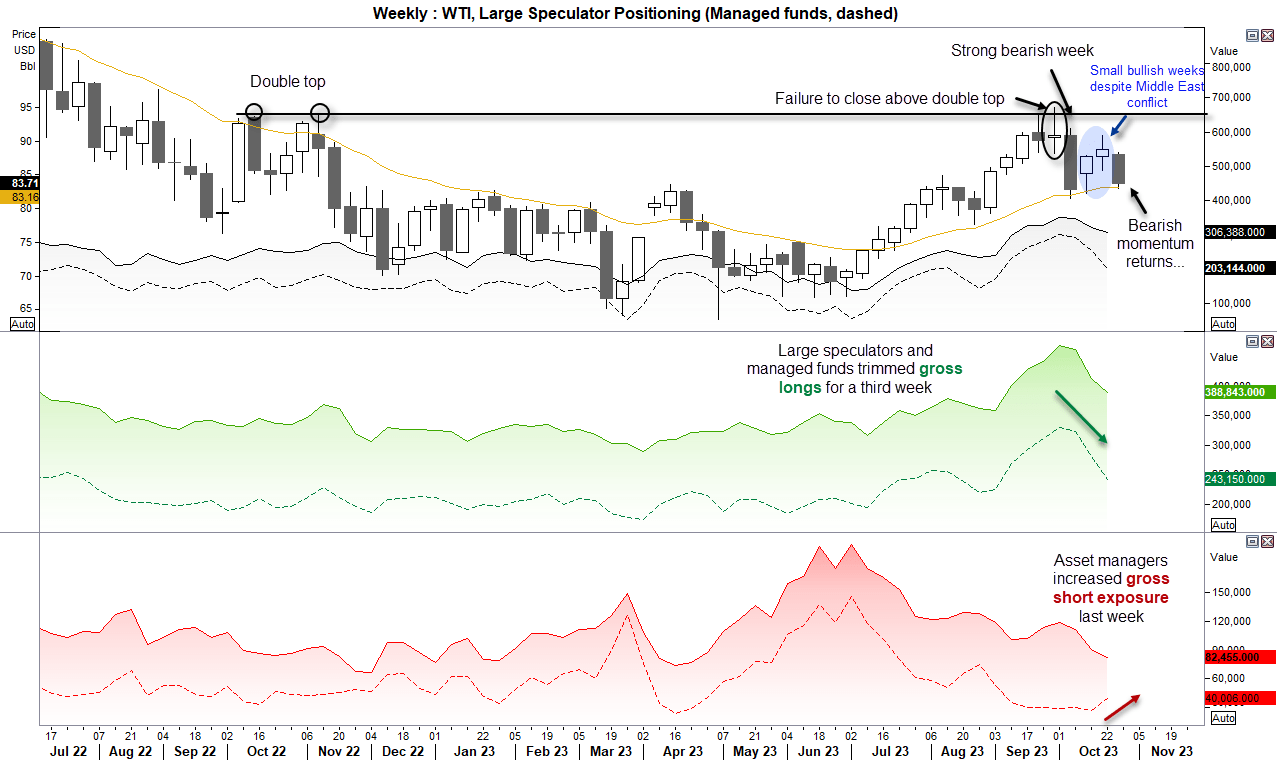
I noted in Monday’s COT report that large speculators and manage funds trimmed longs over the past three weeks, and that managed funds increase shorts last week despite the Middle East conflict. And it is worth mentioning again.
The weekly chart appears to be bearish over the near term to my eyes, and already we can see momentum has turned lower for the week. The Q3 rally failed to close above the ‘double top’ highs and formed an indecision week, before momentum turned swiftly lower. And the fact that we then saw two relatively small bullish candles whilst headlines of a Middle East conflict took centre stage further raised my bearish suspicion. Momentum has turned lower for the week, and if US GDP disappoints of Jerome Powell is more dovish (or less hawkish) as expected, it could reduce Fed hike expectations, weigh on short duration yields and oil prices. Weak data from Europe is also another factor which could weigh on oil prices, and in all the time the Middle East conflict remains contained, oil does not look overly bullish all of a sudden.
WTI crude oil technical analysis (daily chart)
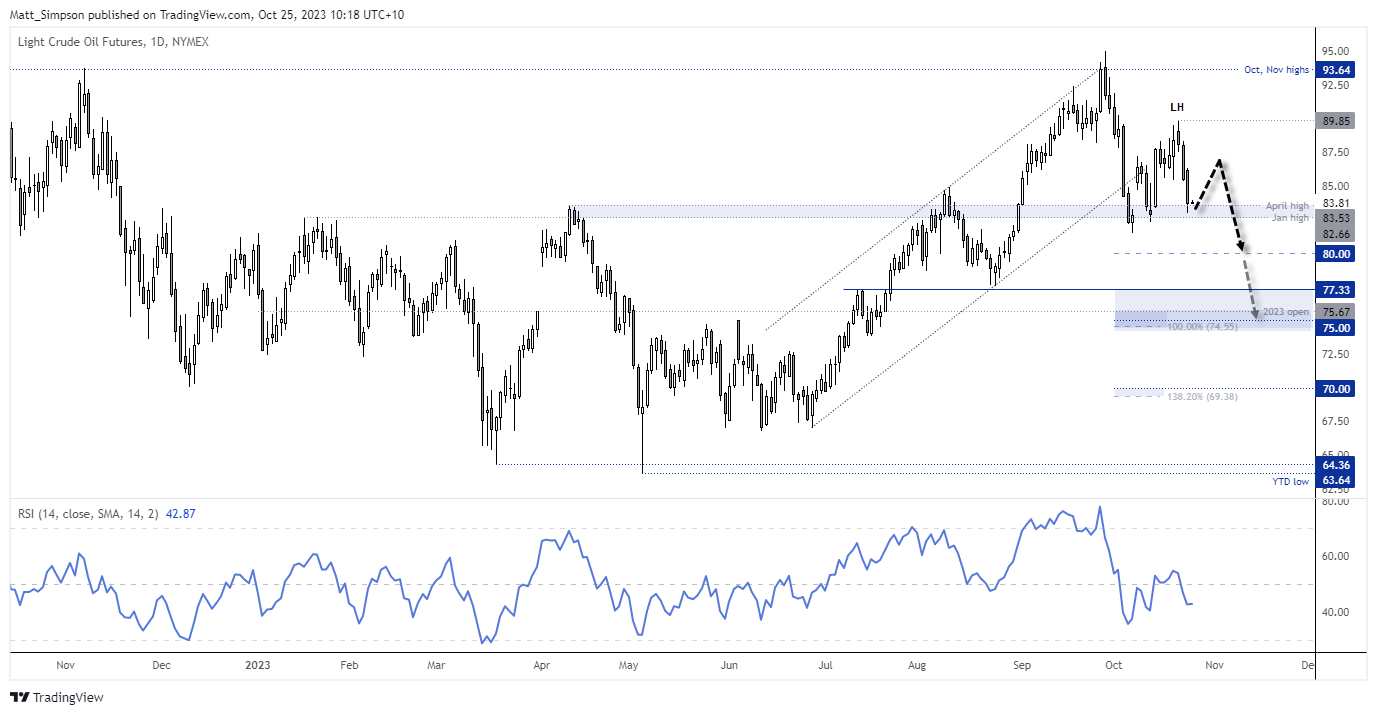
The daily chart shows that bearish momentum since the September peak has outweighed the strength of bullish momentum leading up to the peak. To me that suggests there could be further downside to come, which leaves it a case of identifying adequate reward to risk ratios for bearish setups.
Given support has been found around the January and April highs, I’d prefer to see a bounce from current levels to allow a fade (sell into a rally), on the assumption that prices will finally break support and head for $80. A break beneath which brings 77.33 into view.
However, if this is the beginning of a deeper correction, $75 and $75 may not be out of the question, which reside near the 100% and 138.2% Fibonacci projection levels.
-- Written by Matt Simpson
Follow Matt on Twitter @cLeverEdge
How to trade with City Index
You can trade with City Index by following these four easy steps:
- Open an account, or log in if you’re already a customer
• Open an account in the UK
• Open an account in Australia
• Open an account in Singapore
- Search for the market you want to trade in our award-winning platform
- Choose your position and size, and your stop and limit levels
- Place the trade
Related tags:
Latest market news




The complete CFD trading experience
Award-winning platforms, competitive spreads, low commissions and dedicated support.
We live and breathe the markets and are dedicated to helping traders realise their ambitions as we continue to set the industry bar.
Economic calendar
Web Trader platform
Our sophisticated web-based platform is packed with features.
Related articles
S&P 500 Update: SPX Records Its Biggest Selloff of the Year Ahead of NFP
The trading week has not been particularly favorable for risk appetite in the short term, and this is now becoming increasingly evident in the performance of the S&P 500. During today's session, the index is down nearly 4.2%, marking its largest intraday decline of 2026.
Canadian Dollar Short-term Outlook: USD/CAD Plunge Stalls at Pivotal Support—Range Break in Focus 11 5 2026
Friday’s U.S. and Canadian employment reports could trigger a decisive USD/CAD move as bulls and bears battle for control at critical support.


US Dollar Technical Outlook: DXY Bulls Fight to Hold Critical Support Ahead of NFP 11 5 2026
DXY bulls are attempting to defend a pivotal technical threshold, with the next reaction likely to determine whether the broader recovery survives.
StoneX Europe Ltd may make third party material available on this website which may contain information included but not limited to the conditions of financial markets. The material is for information purposes only and does not contain, and should not be construed as containing, investment advice and/or investment recommendation and/or an investment research and/or an offer of or solicitation for any transactions in financial instruments; any decision to enter into a specific transaction shall be made by the client following an assessment by him/her of their situation.
StoneX Europe Ltd makes no representation or warranty and assumes no liability as to the accuracy or completeness of the information provided, nor any loss arising from any investment based on a recommendation, forecast or other information supplied. You should always seek independent advice as to your suitability to speculate in any related markets and your ability to assume the associated risks, if you are at all unsure. We are not under any obligation to update any such material. Any opinion made may be personal to the author and may not reflect the opinion of StoneX Europe Ltd.