



ASX 200 Outlook: Tech Stocks Surge as Traders Eye Dips
ASX 200 slips below 9000 as tech stocks surge, with traders likely to buy dips despite near-term consolidation risks.
Share this:

The ASX 200 is hovering just below 9000, with price action showing signs of fatigue near the highs. But beneath the surface, strength in the tech sector suggests this remains a market where traders are likely to buy dips, even as a short-term pullback or consolidation unfolds.
View related analysis:
View related analysis:
ASX 200 Forecast: Tech Strength Meets Resistance Near 9000
ASX 200 Market Snapshot
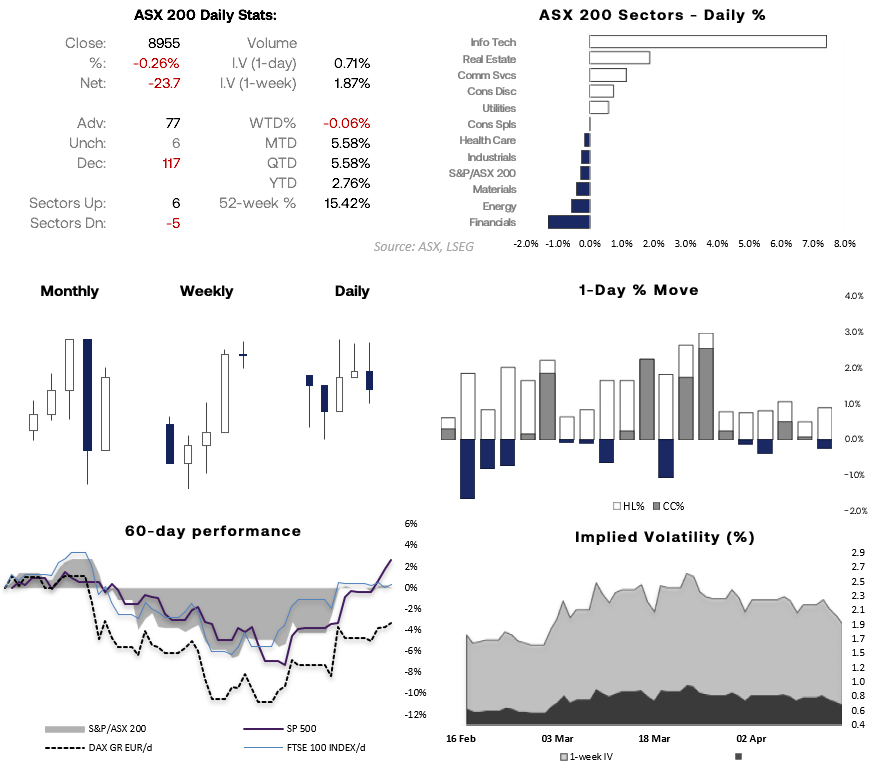
- The Information technology Sector (XIJ) was the clear leader of the five ASX sectors that advanced on Thursday, providing further evidence of an important bottom for the sector
- 6 of the 11 ASX sectors declined, led by Financials (XFJ) and Energy (XEJ)
- Implied volatility has continued to trend lower amid a risk-on tone for global stock markets
- Implied volatility for today is 0.7% according to the 30-day implied volatility index for the S&P ASX 200 VIX (XVI)
- The ASX 20 cash market formed a bearish outside day, following Wednesday’s small shooting star reversal – warning of the potential for a consolidation or minor pullback
Source: ASX, LSEG


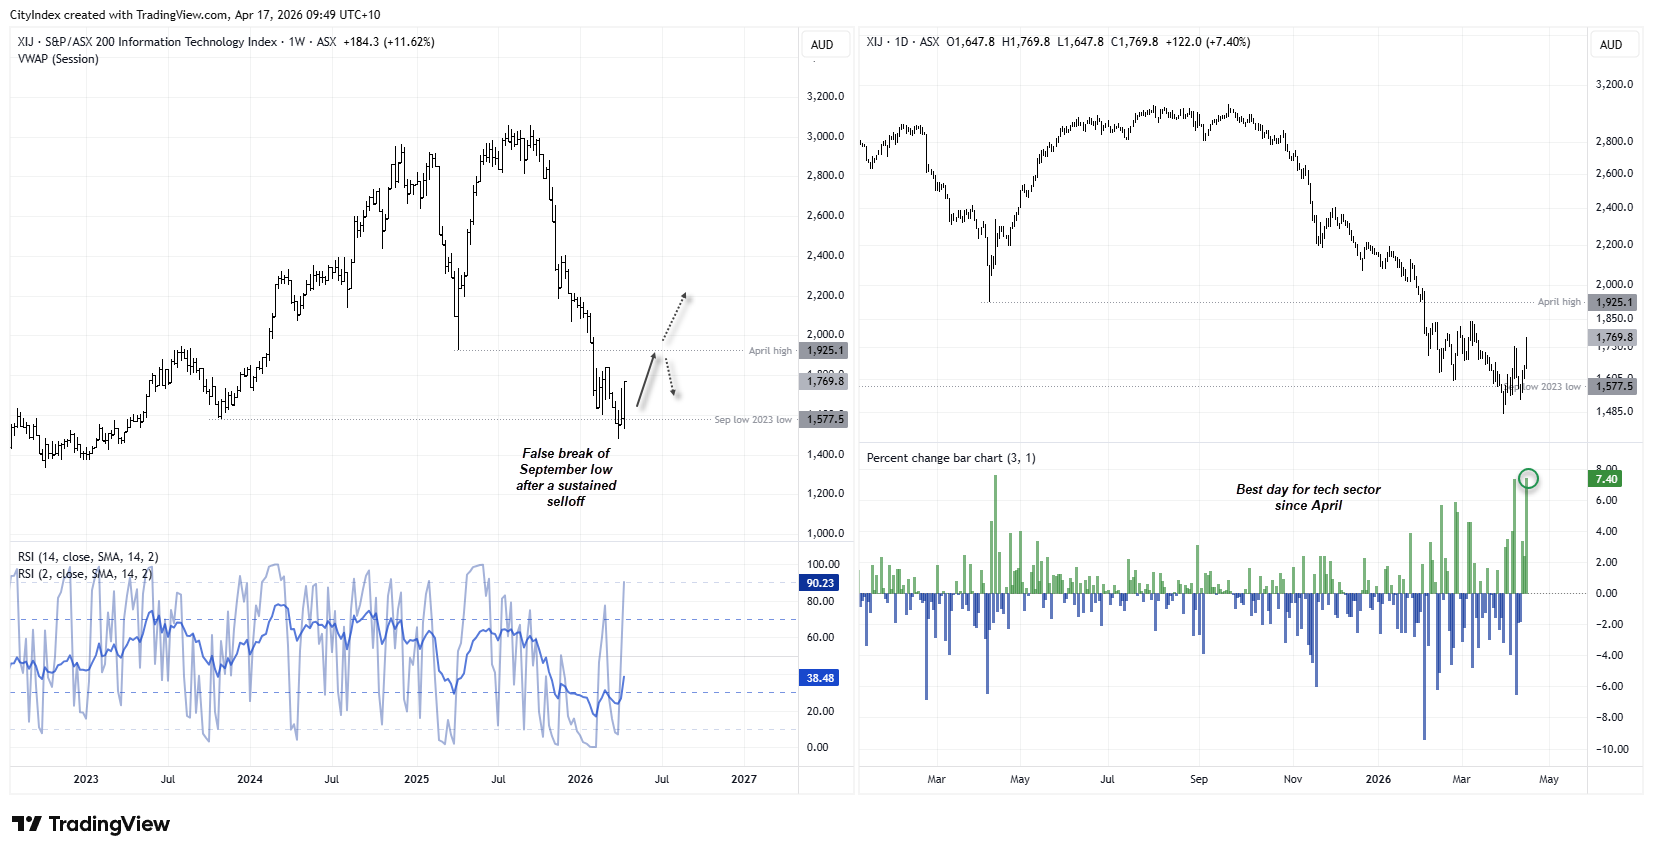
ASX Technology (XIJ) Rebound Gains Traction Above Key Support
ASX Information Technology (XIJ) shows early signs of stabilisation after a sharp selloff, with a false break below key support hinting at buyer interest. While the ASX tech sector is attempting a rebound, the broader trend remains bearish, and further upside confirmation is needed above the April highs to signal a sustained recovery in Australian technology stocks.
Source: ASX, LSEG
ASX 200 Technical Analysis
Bearish Signals Emerge Near Highs Despite Resilient Futures
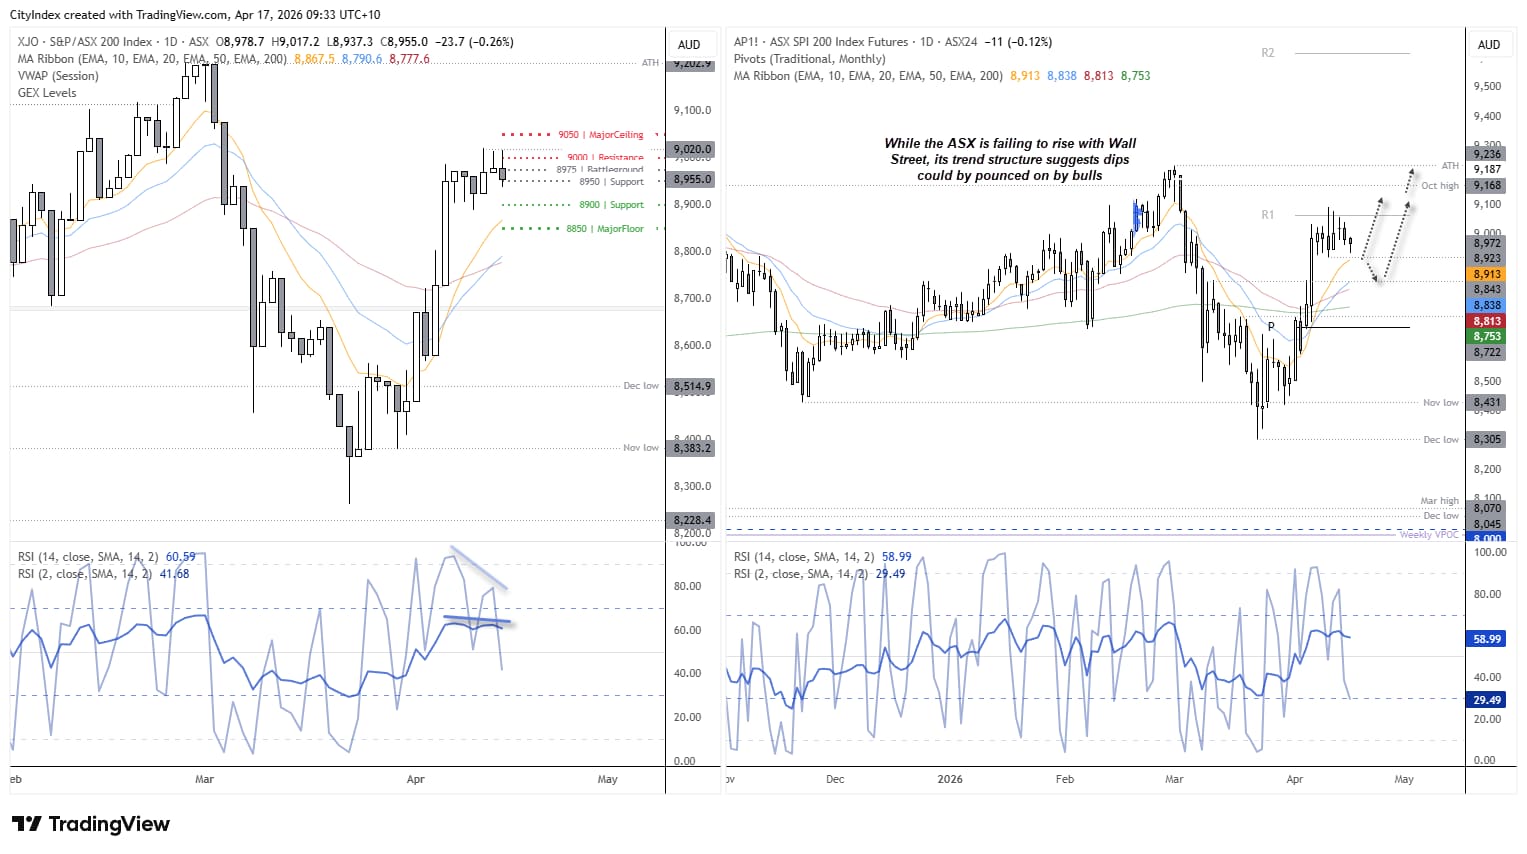
The daily ASX cash market chart (left) shows a bearish outside day formed near the cycle highs. In fact, there appears to be a triple top around 9,020. With bearish divergence on both RSI (2) and RSI (14), a minor pullback could be due.
Meanwhile, the SPI 200 (ASX 200 futures) chart shows prices holding up overnight, refusing to fall but also failing to keep pace with Wall Street’s rally. If the market cannot rise on positive cues, it strengthens the case for at least a near-term pullback.
Even so, bulls may look to buy dips towards the 10 or 20-day EMAs, with a view to a late rally that closes the gap with Wall Street. That could bring the all-time high back into focus over the coming week or two.
Source: ASX, ASX24, TradingView
Options Positioning Points to Tight Range With 9000 as Key Pivot
Options positioning shows the ASX 200 is trading within a tighter, more actionable range. The 8975–8950 area is a key battleground, where price may chop and rotate. Above, 9000–9050 is the resistance zone, where rallies are likely to slow. On the downside, 8900–8850 provides support, where buyers may step in if price pulls back.
In a nutshell: I expect range-bound trading, with chop around 8950–8975, resistance overhead near 9000, and support building below 8900.
View the full economic calendar
View the full economic calendar
-- Written by Matt Simpson
Follow Matt on Twitter @cLeverEdge
How to trade with City Index
You can trade with City Index by following these four easy steps:
- Open an account, or log in if you’re already a customer
• Open an account in the UK
• Open an account in Australia
• Open an account in Singapore
- Search for the market you want to trade in our award-winning platform
- Choose your position and size, and your stop and limit levels
- Place the trade
Related tags:
Latest market news




Open an account in minutes
Experience award-winning platforms with fast and secure execution, and enjoy tight spreads from 0.5 pts on FX and 0.3 pts on indices.
Economic calendar
Web Trader platform
Our sophisticated web-based platform is packed with features.
Related articles
USD/JPY Weekly Outlook: Volatility Has Left the Building
The yen has ignored broad dollar weakness, falling Treasury yields and renewed market turbulence. Yet its relationship with US interest rates remains intact. So why is USD/JPY going absolutely nowhere fast?

Magnificent Seven Earnings Preview: Is the AI Boom Facing Its Biggest Test Yet?
After a wobble in the broader AI trade, the Magnificent Seven" stocks are reporting earnings in the coming week - see the key themes and Nasdaq 100 levels to watch!


Nasdaq 100 forecast: Tech stocks not out of woods yet
US index futures pushed higher in the first half of Friday’s session, taking cues from a strong performance from European equities. Both European and US equity futures extending yesterday’s impressive recovery after the sharp sell-off earlier in the week. But the lingering concerns around the AI investment cycle remain, while bond markets were easing lower again, lifting yields.

This report is intended for general circulation only. It should not be construed as a recommendation, or an offer (or solicitation of an offer) to buy or sell any financial products. The information provided does not take into account your specific investment objectives, financial situation or particular needs. Before you act on any recommendation that may be contained in this report, independent advice ought to be sought from a financial adviser regarding the suitability of the investment product, taking into account your specific investment objectives, financial situation or particular needs.
StoneX Financial Pte. Ltd., may distribute reports produced by its respective foreign entities or affiliates within the StoneX group of companies or third parties pursuant to an arrangement under Regulation 32C of the Financial Advisers Regulations. Where the report is distributed to a person in Singapore who is not an accredited investor, expert investor or an institutional investor (as defined in the Securities Futures Act), StoneX Financial Pte. Ltd. accepts legal responsibility to such persons for the contents of the report only to the extent required by law. Singapore recipients should contact StoneX Financial Pte. Ltd. at 6826 9988 for matters arising from, or in connection with the report.
In the case of all other recipients of this report, to the extent permitted by applicable laws and regulations neither StoneX Financial Pte. Ltd. nor its associated companies will be responsible or liable for any loss or damage incurred arising out of, or in connection with, any use of the information contained in this report and all such liability is hereby expressly disclaimed. No representation or warranty is made, express or implied, that the content of this report is complete or accurate.
StoneX Financial Pte. Ltd. is not under any obligation to update this report.
Trading CFDs carries a high level of risk that may not be suitable for some investors. Consider your investment objectives, level of experience, financial resources, risk appetite and other relevant circumstances carefully. The possibility exists that you could lose some or all of your investments, including your initial deposits. If in doubt, please seek independent expert advice. Visit www.forex.com/en-sg/terms-and-policies for the complete Risk Disclosure Statement.