



ASX 200 Outlook: Futures Rebound Tests Key Resistance as Volatility Rises
ASX 200 futures rebound into key resistance as volatility rises. Can bulls extend gains, or will sellers fade the rally?
Share this:

ASX 200 futures rebounded overnight alongside Wall Street, fully retracing Monday’s losses and pushing back into key resistance levels.
While the broader trend is attempting to stabilise, rising volatility and headline-driven flows suggest the rally may lack conviction. Correlations show the index is behaving like a classic risk asset again—tracking global equities and AUD/USD—though short-term moves remain reactive rather than directional.
View related analysis:
View related analysis:
ASX 200 Futures Test Resistance as Volatility Picks Up
ASX 200 Market Snapshot
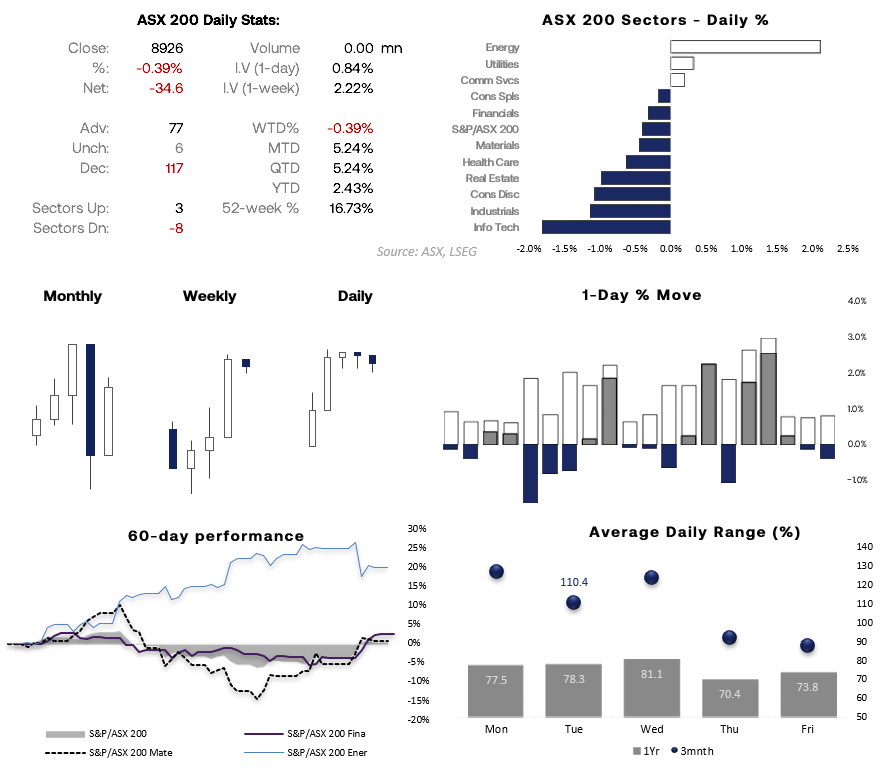
- The risk-off start to the week saw the ASX 200 cash market fall for a second day, closing -0.39% lower
- 9 sectors declined, led by technology (XIJ), industrials (XNJ), and consumer discretionary (XDJ)
- Note how average daily volatility has increased noticeably over the past 3 months, driven by geopolitical developments in the Middle East compared with the previous year
- Monday has typically been the most volatile day, followed by Wednesday, with Tuesday the third most volatile for the ASX 200 over the past 3 months
Source: ASX, LSEG
ASX 200 Correlations
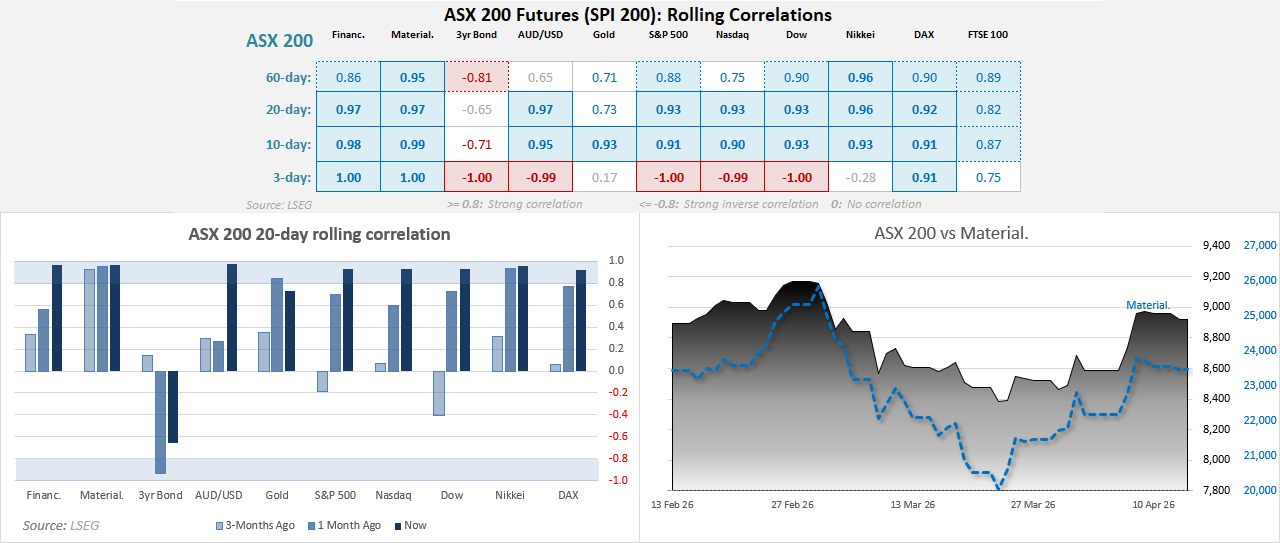
- Equities remain tightly linked: The ASX 200 continues to show strong positive correlations with global indices (S&P 500, Nasdaq, Dow, DAX, Nikkei), reinforcing its role as a risk proxy
- Materials and financials still dominate: Correlations with materials (~0.95–0.99) and financials remain very high, highlighting how heavily the index leans on these sectors
- Bond yields remain inversely correlated: The ASX 200 maintains a negative relationship with 3-year bond yields, though this has fluctuated—suggesting rate expectations are still a key swing factor
- AUD/USD correlation has surged: The 20-day and 10-day correlations show a strong positive relationship with AUD/USD, signalling FX is back in play as a driver of equity sentiment
- Gold correlation is strengthening: Gold now shows a firmer positive correlation, hinting that both may be reacting to the same macro drivers (inflation, geopolitics), rather than diverging
- Short-term correlations are unstable: The 3-day data shows extreme swings (including inverse moves), which tells you positioning is reactive and headline-driven—not stable trend behaviour
Source: ASX, LSEG
ASX 200 Technical Analysis
Options Positioning Signals Break Higher with Momentum
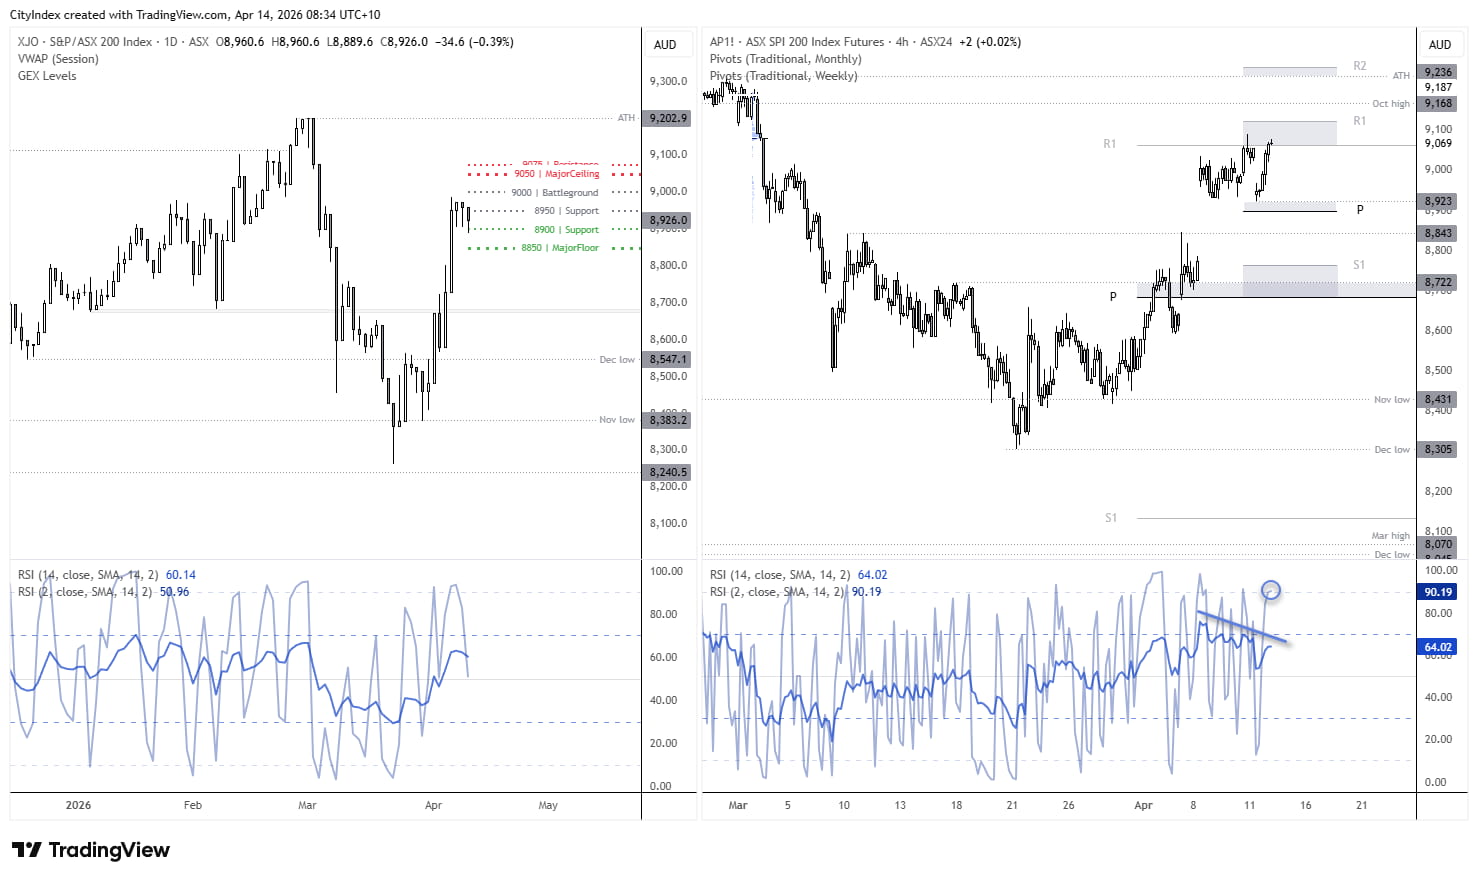
Options positioning suggests the ASX 200 is breaking into a higher range, with strong upside momentum following the overnight move in SPI futures. The 9000 level has now flipped into a key pivot, where price may find support on pullbacks. Above, 9050–9075 is the next resistance zone, where rallies may begin to slow. On the downside, 8900–8850 forms a support area, where buyers may step in if momentum fades.
Ultimately, momentum has turned bullish, with dips likely to be bought above 9000 — but traders should watch for potential resistance near 9050–9075.


SPI 200 (ASX 200 Futures) higher Overnight
Wall Street futures were higher overnight, helping ASX 200 futures rise 1.3% and fully recoup Monday’s gap lower. However, price remains beneath Monday’s high and is now trading around the monthly R1 pivot (9063).
The 9100 handle, weekly R1 pivot (9123), and October high (9168) are all nearby resistance levels. Beyond that, the all-time high (9236) and weekly R2 pivot (9258) come into view should bulls gain momentum.
That said, such an extended bullish run seems unlikely unless a ceasefire returns and evolves into a sustained deal. While futures are higher, there may be opportunities for bears to fade rallies into resistance for mean reversion lower—unless a confirmed deal emerges. Also note the bearish diovergence eon the 4-hour RSI (14) and the RSI (2) is overbought)
In that case, note the weekly pivot point sits near the 8900 handle, close to Monday’s low.
Source: ASX, TradingView
View the full economic calendar
View the full economic calendar
-- Written by Matt Simpson
Follow Matt on Twitter @cLeverEdge
How to trade with City Index
You can trade with City Index by following these four easy steps:
- Open an account, or log in if you’re already a customer
• Open an account in the UK
• Open an account in Australia
• Open an account in Singapore
- Search for the market you want to trade in our award-winning platform
- Choose your position and size, and your stop and limit levels
- Place the trade
Related tags:
Latest market news




Open an account in minutes
Experience award-winning platforms with fast and secure execution, and enjoy tight spreads from 0.5 pts on FX and 0.3 pts on indices.
Economic calendar
Web Trader platform
Our sophisticated web-based platform is packed with features.
Related articles

Gold, EUR/USD hit 2026 lows as US yields erupt
US Treasury yields have staged one of their largest four-session increases in decades, hammering EUR/USD and gold. But while the euro's decline makes sense, gold's reaction has been extraordinary.


Gold Feels the Weight of USD, Yields on Hawkish Fed and CPI
Gold remains under pressure as hot US CPI, rising Treasury yields and hawkish Fed commentary support the US dollar. Bears eye another break below $4,000

ASX 200 Futures Hold Relatively Firm as Nikkei Plunges After Wall Street Rout
Wall Street's AI-led rout sends Nikkei futures plunging 9%, while ASX 200 futures hold relatively firm despite surging volatility and broader risk aversion.
This report is intended for general circulation only. It should not be construed as a recommendation, or an offer (or solicitation of an offer) to buy or sell any financial products. The information provided does not take into account your specific investment objectives, financial situation or particular needs. Before you act on any recommendation that may be contained in this report, independent advice ought to be sought from a financial adviser regarding the suitability of the investment product, taking into account your specific investment objectives, financial situation or particular needs.
StoneX Financial Pte. Ltd., may distribute reports produced by its respective foreign entities or affiliates within the StoneX group of companies or third parties pursuant to an arrangement under Regulation 32C of the Financial Advisers Regulations. Where the report is distributed to a person in Singapore who is not an accredited investor, expert investor or an institutional investor (as defined in the Securities Futures Act), StoneX Financial Pte. Ltd. accepts legal responsibility to such persons for the contents of the report only to the extent required by law. Singapore recipients should contact StoneX Financial Pte. Ltd. at 6826 9988 for matters arising from, or in connection with the report.
In the case of all other recipients of this report, to the extent permitted by applicable laws and regulations neither StoneX Financial Pte. Ltd. nor its associated companies will be responsible or liable for any loss or damage incurred arising out of, or in connection with, any use of the information contained in this report and all such liability is hereby expressly disclaimed. No representation or warranty is made, express or implied, that the content of this report is complete or accurate.
StoneX Financial Pte. Ltd. is not under any obligation to update this report.
Trading CFDs carries a high level of risk that may not be suitable for some investors. Consider your investment objectives, level of experience, financial resources, risk appetite and other relevant circumstances carefully. The possibility exists that you could lose some or all of your investments, including your initial deposits. If in doubt, please seek independent expert advice. Visit www.forex.com/en-sg/terms-and-policies for the complete Risk Disclosure Statement.