








AU employment data leaves no room for RBA easing: AUD/USD, AUD/CHF
Over the past few hours we have seen the Fed hint at multiple cuts this year, and Australian employment data outperform to send AUD/USD above 66c.
Share this:

Australian employment report highlights
- Unemployment fell to 3.7% (4% prior, below its 12-month MA)
- 116.5k jobs added (78.2k of which were full time)
- AUD/USD broke convincingly above 66c as bears likely trimmed dovish-RBA bets
- AU 3-year bond fell 9bp initially (now down -6bp) and yields rose
We’re seeing quite a bit of noise in Australia’s employment figures of late, which is making it difficult to interpret the trend. December’s figures revealed a surprise 110.8k slashing of full-tome jobs, before unemployment rose to a 2-year high of 4% in January which increased the odds of RBA easing.
So it did come as a surprise to see job growth rise 116.5k in February and unemployment fall back to 3.7%. The fact that 78.2k full-time jobs were added certainly helps soften the blow from December’s FT culling, but it does bring into question which outlier numbers we should be focussing on; the good or the bad?
Well, given we just had a surprisingly dovish FOMC meeting, today’s strong employment figures have at least seen some AUD/USD bears run for cover. As these numbers aren’t exactly what we’d expect to see from an economy that is due a rate cut any time soon. Services PMI also expanded at a faster pace than expected earlier today. Therefore, I’ll stick with my observation from Tuesday’s RBA meeting’ a 3.5% cash rate is set to stay for some time.
AUD/USD technical analysis:
The Australian dollar broke convincingly above 66c following the employment report, and has now fully recovered losses sustained over the past week. The bullish momentum of the past two days likely invalidates any hope of the potential head and shoulders pattern I noted in today’s Asian open report.
The 1-hour chart shows strong bullish momentum heading into 0.6620. It trades above the high-volume node of the prior decline and seemingly on track to head for the 0.6650/60 region. Yet this is not an easy market to be bullish on at these levels, from a reward to risk perspective.
Bulls could either revert to very low times to seek bullish continuation pattern on the assumption AUD/USD will continue higher. Personally, I’d prefer to see a retracement on the 1-hour timeframe before reconsidering its potential for a swing trade long, above or around 66c or the weekly pivot point.
AUD/CHF technical analysis:
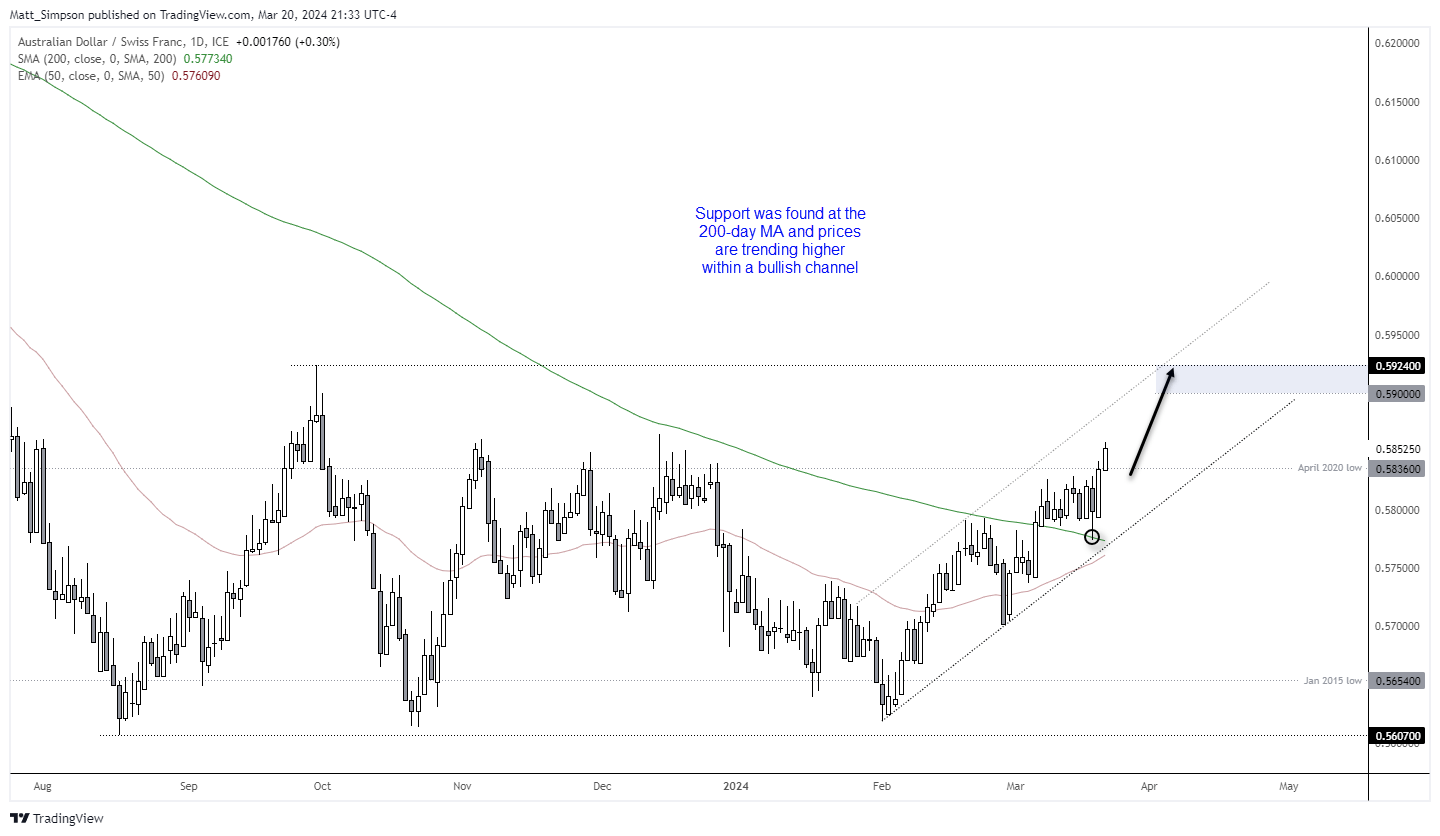
This is not a pair I look at often, but a divergent theme could be building on AUD/CHF to favour long positions over the coming week/s. The cross has been within an established downtrend on the weekly chart since 2017, although a triple bottom formed just above 0.5600 and momentum has pushed prices up to the top of its sideways range.
With the RAB set to hold at a relatively high 4.35%, the SNB are likely to cut and signal easing first. They just so happen to be announcing their monetary policy decision later today.
The daily chart shows that a bullish trend has emerged within a rising channel, and support was found at the 200-day MA ahead of a break above the April 2020 low. From here, the bias is to seek dips within the channel and target 0.5900 or the upper trendline – whichever comes first.
-- Written by Matt Simpson
Follow Matt on Twitter @cLeverEdge
How to trade with City Index
You can trade with City Index by following these four easy steps:
- Open an account, or log in if you’re already a customer
• Open an account in the UK
• Open an account in Australia
• Open an account in Singapore
- Search for the market you want to trade in our award-winning platform
- Choose your position and size, and your stop and limit levels
- Place the trade
Related tags:


Open an account in minutes
Experience award-winning platforms with fast and secure execution, and enjoy tight spreads from 0.5 pts on FX and 0.3 pts on indices.
Economic calendar
Web Trader platform
Our sophisticated web-based platform is packed with features.
Related articles

US Dollar Bulls Return as Euro and Pound Shorts Build | COT Report
US dollar net-longs surged at their fastest pace in seven years as futures traders added bearish exposure to the euro and British pound.

Gold Outlook: XAU/USD hit hard as US yields, dollar resume ascent
A stronger dollar, surging front-end yields and renewed geopolitical tension have combined to push gold back towards key technical support.


Australian Dollar Outlook: AUD/USD Holds 70c Ahead of RBA and CPI
AUD/USD faces an expected RBA hike and Australian CPI before attention turns to US PCE, ISM and nonfarm payrolls later in the week.
This report is intended for general circulation only. It should not be construed as a recommendation, or an offer (or solicitation of an offer) to buy or sell any financial products. The information provided does not take into account your specific investment objectives, financial situation or particular needs. Before you act on any recommendation that may be contained in this report, independent advice ought to be sought from a financial adviser regarding the suitability of the investment product, taking into account your specific investment objectives, financial situation or particular needs.
StoneX Financial Pte. Ltd., may distribute reports produced by its respective foreign entities or affiliates within the StoneX group of companies or third parties pursuant to an arrangement under Regulation 32C of the Financial Advisers Regulations. Where the report is distributed to a person in Singapore who is not an accredited investor, expert investor or an institutional investor (as defined in the Securities Futures Act), StoneX Financial Pte. Ltd. accepts legal responsibility to such persons for the contents of the report only to the extent required by law. Singapore recipients should contact StoneX Financial Pte. Ltd. at 6826 9988 for matters arising from, or in connection with the report.
In the case of all other recipients of this report, to the extent permitted by applicable laws and regulations neither StoneX Financial Pte. Ltd. nor its associated companies will be responsible or liable for any loss or damage incurred arising out of, or in connection with, any use of the information contained in this report and all such liability is hereby expressly disclaimed. No representation or warranty is made, express or implied, that the content of this report is complete or accurate.
StoneX Financial Pte. Ltd. is not under any obligation to update this report.
Trading CFDs carries a high level of risk that may not be suitable for some investors. Consider your investment objectives, level of experience, financial resources, risk appetite and other relevant circumstances carefully. The possibility exists that you could lose some or all of your investments, including your initial deposits. If in doubt, please seek independent expert advice. Visit www.forex.com/en-sg/terms-and-policies for the complete Risk Disclosure Statement.