





AUD/USD Breaks Higher as US Dollar Extends Decline Toward Key Support
AUD/USD clears 0.6550 as bullish breakout gains traction; US dollar index (DXY) nears 2023 low with downside risks mounting.
Share this:

The Australian dollar has finally broken above a key resistance level, propelled by renewed rate cut bets for the Federal Reserve and bullish technical momentum. With AUD/USD pushing toward the 0.66 handle and the US dollar index (DXY) approaching critical support, traders are watching for potential follow-through or short-term shakeouts. This breakout could mark the beginning of a more sustained upside for the Aussie, especially as the Fed’s dovish shift gathers pace.
Australian Dollar Breakout Gains Momentum as US Dollar Weakens
We’ve finally seen the Australian dollar break out and clear the long-term 61.8% Fibonacci retracement level at 0.6550 on the AUD/USD chart. As noted yesterday, I suspected a bullish breakout was brewing following a multi-week grind higher, supported by renewed Federal Reserve rate cut bets and a weekly bullish engulfing candle on AUD/USD.
View related analysis:
View related analysis:
AUD/USD Technical Analysis: Australian Dollar vs US Dollar
Prices are now just pips away from the 0.66 handle — a level likely to be tested today. The daily RSI (14) has broken above trend resistance but remains below overbought territory, suggesting room for further upside. The Aussie dollar could now be targeting the 200-week simple moving average (SMA) at 0.6724, near the weekly volume point of control (VPOC) at 0.6733. The 0.6760 area also shapes up as a probable resistance zone.
Chart analysis by Matt Simpson - Source: TradingView

However, with the US Dollar Index (DXY) nearing key support and Australia’s 3-year yield reclaiming its head and shoulders neckline, a brief shakeout near 66c or a minor pullback would not surprise. Still, the trend structure remains favourable, and AUD/USD bulls may look to buy dips towards 0.65 — near a weekly VPOC — should any such pullback occur.
US Dollar Index (DXY) Technical Analysis
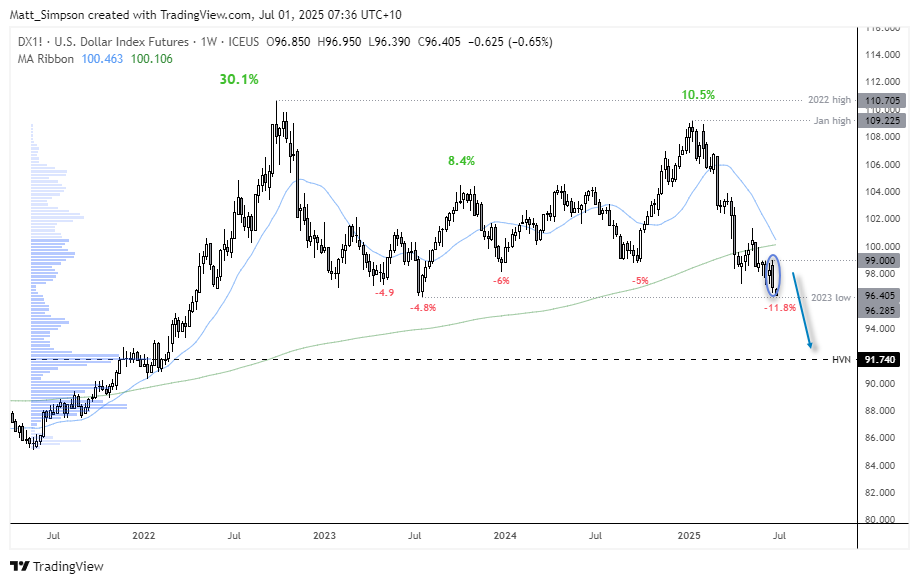
Chart analysis by Matt Simpson - Source: TradingView / ICE
The US dollar index (DXY) has been in decline since peaking at 109.23 on January 16, now down -11.8% — marking its sharpest drawdown since the 2022 high. Given the sustained downward trajectory, the selloff appears poised to continue. Friday’s bearish engulfing candle suggests a lower high beneath the 200-day simple moving average (SMA), and DXY is now testing the 2023 low at 96.28.
Some price noise around this level wouldn’t be surprising, and that could momentarily temper the Australian dollar's upside. Still, the broader bias for AUD/USD remains bullish, with dips likely to attract buyers.
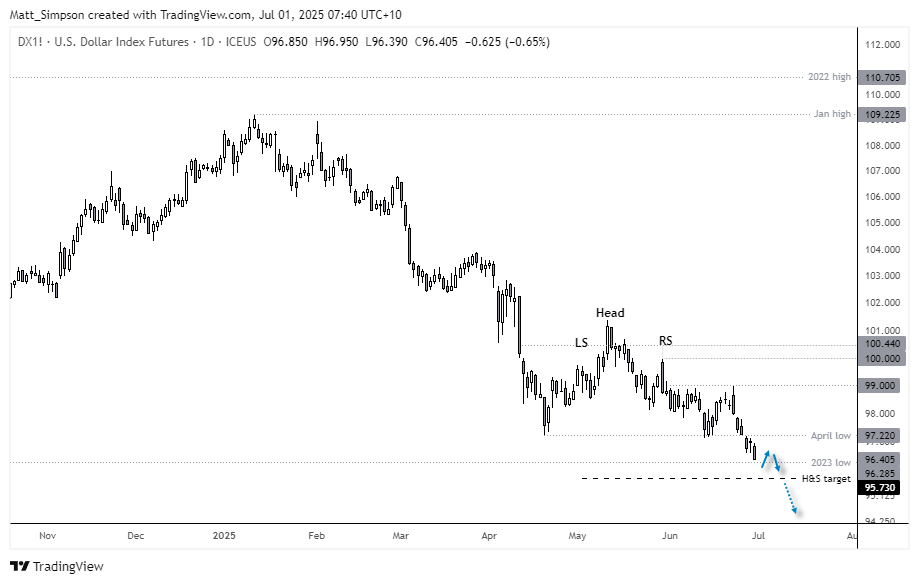
Chart analysis by Matt Simpson - Source: TradingView / ICE
Technically, DXY is approaching the minimum target of a head and shoulders (H&S) top pattern near 95.73. However, further weakness could push the index towards the high-volume node (HVN) at 91.74 in the coming weeks — particularly if Fed Chair Powell yields to political pressure and soft economic data triggers a dovish policy shift.
Economic Events in Focus (AEST / GMT+10)
08:00 NZD NZIER Business Confidence (Q2), NZIER QSBO Capacity Utilization (Q2) (NZD/USD, NZX 50)
08:45 NZD Building Consents (May) (NZD/USD, NZX 50)
09:00 AUD Judo Bank Manufacturing PMI (Jun) (AUD/USD, ASX 200)
09:01 GBP BRC Shop Price Index (GBP/USD, FTSE 100)
09:50 JPY Tankan Survey (Q2) (USD/JPY, Nikkei 225)
10:30 JPY au Jibun Bank Manufacturing PMI (Jun) (USD/JPY, Nikkei 225)
11:45 CNY Caixin Manufacturing PMI (Jun) (USD/CNH, China A50)
13:35 JPY 10-Year JGB Auction (USD/JPY, Nikkei 225)
15:00 JPY Household Confidence (Jun) (USD/JPY, Nikkei 225)
17:30 CHF Manufacturing PMI (Jun) (USD/CHF, SMI)
17:55 EUR German Manufacturing PMI (Jun), German Unemployment (Jun) (EUR/USD, DAX)
18:00 EUR Eurozone Manufacturing PMI (Jun) (EUR/USD, Euro Stoxx 50)
18:30 GBP S&P Global Manufacturing PMI (Jun) (GBP/USD, FTSE 100)
19:00 EUR CPI & Core CPI (Jun) (EUR/USD, DAX)
22:55 USD Redbook (YoY) (USD, S&P 500, Nasdaq 100, Dow Jones)
23:30 GBP BoE Gov Bailey Speaks (GBP/USD, FTSE 100)
23:30 USD Fed Chair Powell Speaks (USD, S&P 500, Nasdaq 100, Dow Jones)
23:30 JPY BoJ Gov Ueda Speaks (USD/JPY, Nikkei 225)
23:30 EUR ECB President Lagarde Speaks (EUR/USD, DAX)
23:45 USD S&P Global Manufacturing PMI (Jun) (USD, S&P 500, Nasdaq 100, Dow Jones)
00:00 USD ISM Manufacturing PMI (Jun), Construction Spending (May), JOLTS Job Openings (May) (USD, S&P 500, Nasdaq 100, Dow Jones)
View the full economic calendar
View the full economic calendar
-- Written by Matt Simpson
Follow Matt on Twitter @cLeverEdge
How to trade with City Index
You can trade with City Index by following these four easy steps:
- Open an account, or log in if you’re already a customer
• Open an account in the UK
• Open an account in Australia
• Open an account in Singapore
- Search for the market you want to trade in our award-winning platform
- Choose your position and size, and your stop and limit levels
- Place the trade
Related tags:


Open an account in minutes
Experience award-winning platforms with fast and secure execution, and enjoy tight spreads from 0.5 pts on FX and 0.3 pts on indices.
Economic calendar
Web Trader platform
Our sophisticated web-based platform is packed with features.
Related articles

US Dollar Bulls Hold Firm, but Euro Warns of Squeeze Risk | COT Report
US dollar bulls remain firmly positioned, but record euro shorts have failed to break EUR/USD support, raising the risk of a short-covering rally.

USD/CAD reversal risk builds as central bank showdown looms
USD/CAD has delivered a bullish reversal signal from established support, just as traders prepare for Fed and BoC decisions. Aggressive Canadian rate hike expectations and conflicting momentum signals make the coming session important.


Australian Dollar Outlook: AUD/USD Screams Sentiment Extreme Into Fed, CPI
AUD/USD rebounds despite record bearish futures positioning, with Australian Q3 CPI and the Fed meeting threatening to trigger another short squeeze.
This report is intended for general circulation only. It should not be construed as a recommendation, or an offer (or solicitation of an offer) to buy or sell any financial products. The information provided does not take into account your specific investment objectives, financial situation or particular needs. Before you act on any recommendation that may be contained in this report, independent advice ought to be sought from a financial adviser regarding the suitability of the investment product, taking into account your specific investment objectives, financial situation or particular needs.
StoneX Financial Pte. Ltd., may distribute reports produced by its respective foreign entities or affiliates within the StoneX group of companies or third parties pursuant to an arrangement under Regulation 32C of the Financial Advisers Regulations. Where the report is distributed to a person in Singapore who is not an accredited investor, expert investor or an institutional investor (as defined in the Securities Futures Act), StoneX Financial Pte. Ltd. accepts legal responsibility to such persons for the contents of the report only to the extent required by law. Singapore recipients should contact StoneX Financial Pte. Ltd. at 6826 9988 for matters arising from, or in connection with the report.
In the case of all other recipients of this report, to the extent permitted by applicable laws and regulations neither StoneX Financial Pte. Ltd. nor its associated companies will be responsible or liable for any loss or damage incurred arising out of, or in connection with, any use of the information contained in this report and all such liability is hereby expressly disclaimed. No representation or warranty is made, express or implied, that the content of this report is complete or accurate.
StoneX Financial Pte. Ltd. is not under any obligation to update this report.
Trading CFDs carries a high level of risk that may not be suitable for some investors. Consider your investment objectives, level of experience, financial resources, risk appetite and other relevant circumstances carefully. The possibility exists that you could lose some or all of your investments, including your initial deposits. If in doubt, please seek independent expert advice. Visit www.forex.com/en-sg/terms-and-policies for the complete Risk Disclosure Statement.