



AUD/USD outlook: Hot CPI dents RBA cut hopes, hawkish risks rise
Sticky domestic inflation and hawkish repricing have shifted the RBA narrative. Could this be the start of a sustained AUD recovery?
Share this:

- CPI beats across headline and trimmed mean, both above target
- Housing and services inflation remain stubbornly high
- Market pricing slashes cut expectations, hints at hike risk
- AUD/USD rebound modest but technicals signal upside potential
Summary
Australia’s latest inflation shock has upended the RBA outlook, killing near-term cut hopes and even raising the prospect of a hike. With underlying pressures entrenched and market pricing turning hawkish, AUD/USD may be entering a new phase. Technical signals point to fading bearish momentum, adding to upside risks if global conditions stay supportive.
Uncomfortably Hot
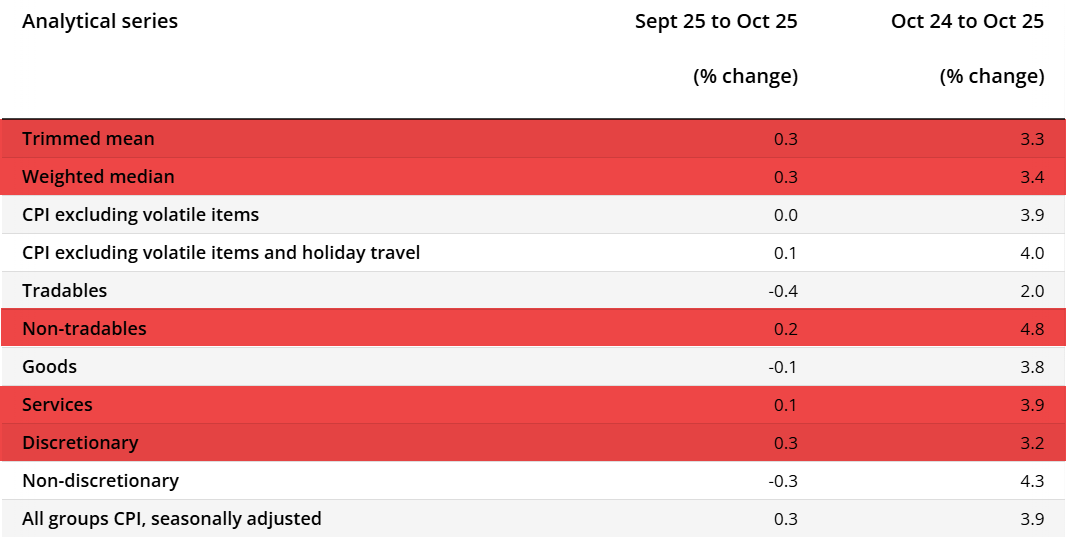
Australia’s first full monthly CPI release delivered an uncomfortable reality check for those banking on further RBA rate cuts. Headline inflation accelerated to an annual pace of 3.8%, above the 3.6% expected, while trimmed mean—the measure the RBA places the greatest weight on—jumped to 3.3%, well above the 3.0% forecast. Both readings sit not only above the top of the RBA’s 2–3% target band but are moving further away from it, suggesting the recent downtrend in inflation has likely bottomed.

Source: ABS
That’s significant because the RBA’s inflation mandate is anchored around the 2.5% midpoint, and its policy framework assumes underlying inflation leads headline, not the other way around. Today’s data reinforces that assumption in the worst possible way: underlying pressures are firming, not easing, making it harder to argue for near-term policy relief.
The composition adds to the discomfort. Housing inflation, the largest weighting in the CPI basket and highly sensitive to economic conditions, strengthened further. Rents rose 4.2% over the year, up from 3.8% in September, with the increase partly reflecting a smaller offset from Commonwealth Rent Assistance compared to a year ago. Excluding those adjustments, rents would have risen 4.5%, underscoring persistent tightness in rental markets. New dwelling prices also firmed, rising 1.7%. Combined with surging electricity costs, these trends point to housing pressures that are not going away quickly.
Source: ABS
Beyond housing, the broader picture is equally troubling. Services prices are running at 3.9%, while non-tradables inflation is even hotter at 4.8%. Both are heavily influenced by domestic factors rather than international ones, and they sit alongside other major categories growing at annual rates above the RBA target range. This mix suggests that price stickiness is not confined to a few sectors but embedded across the economy, making it harder to keep inflation low and stable even with subdued growth.
One caveat regarding the data was this was the first time we've seen a monthly release in Australia, which introduces some uncertainty around the signal. Even so, it aligns with the strength seen in the Q3 inflation report, meaning the trend is real. While the RBA will continue to lean on quarterly data for now, this print is hard to ignore. For those hoping for rate cuts, this is a setback—the inflation fight looks far from over.


RBA Easing Cycle Seen Over
Source: Bloomberg
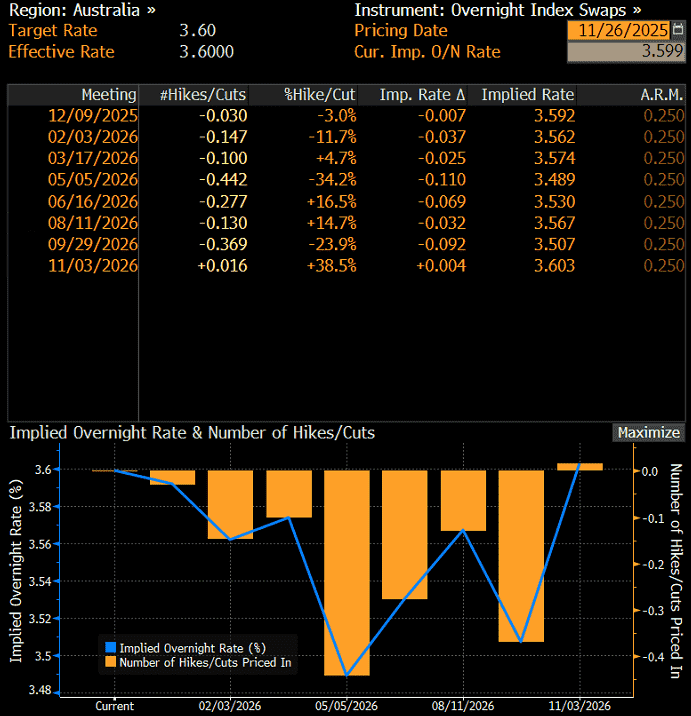
If the inflation data wasn’t enough to unsettle rate-cut expectations, market pricing certainly drives the point home. Swaps now imply a maximum of 11 basis points of easing by May 2026, with a small risk that the next move in the cash rate could actually be higher six months later. That’s a dramatic hawkish repricing compared to just a few months ago when the cash rate was seen bottoming below 3%. Now, no further easing is favored over another cut.
The residual pricing for cuts looks more like insurance than conviction—hedging against an unexpected negative shock, such as unemployment rising far beyond the RBA’s forecasts or a major global downturn. With inflation running hot and underlying pressures entrenched, the only realistic path to near-term cuts would be a sharp deterioration in the labor market or a significant external shock. Absent that, the easing cycle is likely over.
AUD/USD Eyeing Upside
Source: TradingView
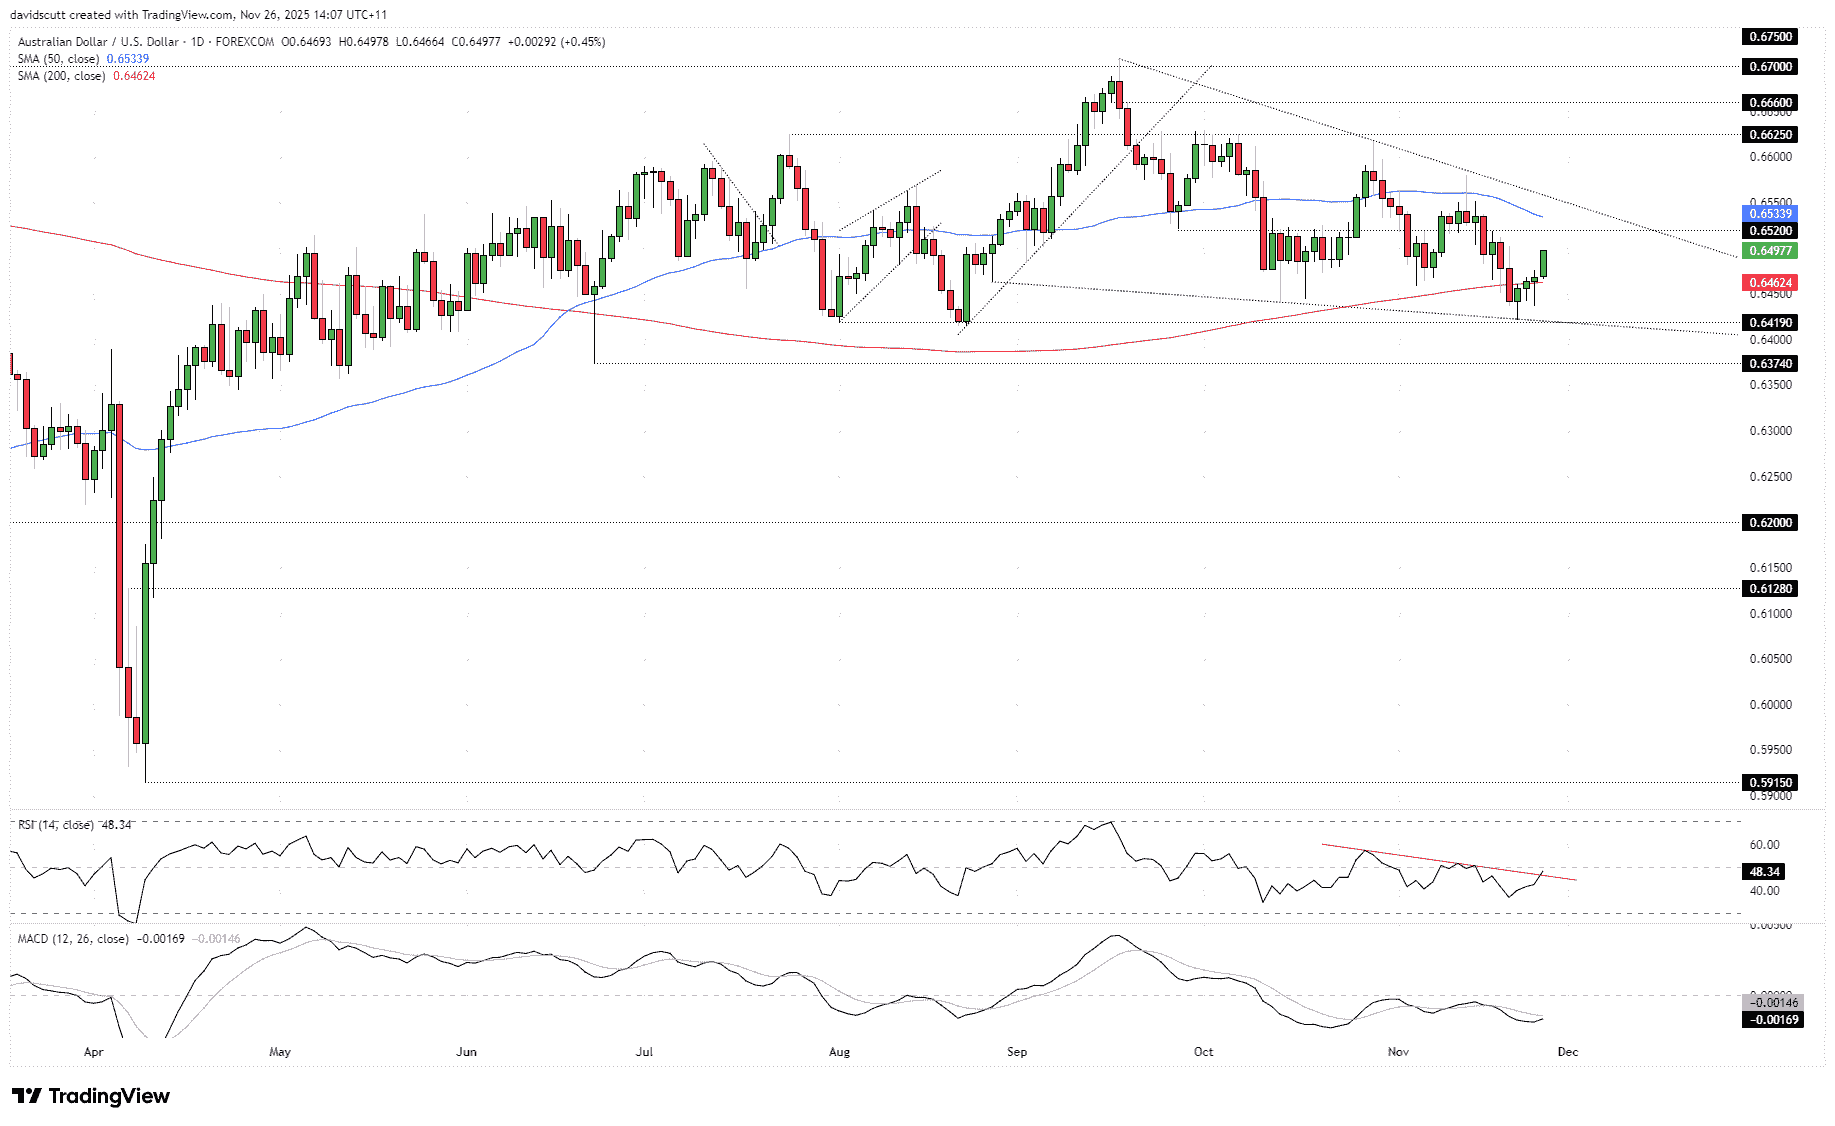
AUD/USD extended its rebound from beneath the 200DMA following the release, although the scale of the move relative to the signal appears modest. This hints at possible headwinds from a surging Kiwi dollar after the RBNZ shifted to a neutral policy stance at its November meeting. Selling in AUD/NZD may therefore be capping the Aussie’s advance for now.
Even so, AUD/USD’s trajectory points to a potential test of 0.6520 soon—a level that has repeatedly acted as support and resistance in recent months. Above that, the 50DMA and the September downtrend are key levels to watch, particularly as the pair coils within a falling wedge. A clean break of the downtrend would open the door to higher levels such as 0.6625, 0.6660, and 0.6700. Beneath where the pair trades, the 200DMA and 0.6419 should be on the radar if a reversal occurs.
RSI (14) and MACD suggest shifting momentum, with dominant downside pressure now fading rapidly. The signal is not outright bullish, but it does indicate bears are losing control over the pair’s direction.
With easing cycles from the Antipodean central banks likely over, today could prove important for both AUD and NZD, especially as market pricing for Fed rate cuts continues to grow. That points to rising upside risks for AUD/USD and NZD/USD in the absence of a major risk-off event.
Latest market news




Open an account in minutes
Experience award-winning platforms with fast and secure execution, and enjoy tight spreads from 0.5 pts on FX and 0.3 pts on indices.
Economic calendar
Web Trader platform
Our sophisticated web-based platform is packed with features.
Related articles
GBP/USD, GBP/AUD: Sterling Rally Faces a BoE Reality Check
Sterling faces a reality check as the BoE prepares to hike rates. GBP/USD and GBP/AUD approach resistance, leaving bulls vulnerable to dovish guidance.
Swiss Franc Short-term Outlook: USD/CHF Selloff Nears Critical Support Ahead of NFP 11 4 2026
USD/CHF bears are closing in on critical trend support, with the next reaction likely to determine whether the October decline has further to run.

US Midterm Fallout: What Does the “Blue Tsunami” Mean for the S&P 500?
Democrats made sweeping gains in the US midterm elections, winning control of both the House and Senate - what does it mean for the S&P 500 and the AI trade?

This report is intended for general circulation only. It should not be construed as a recommendation, or an offer (or solicitation of an offer) to buy or sell any financial products. The information provided does not take into account your specific investment objectives, financial situation or particular needs. Before you act on any recommendation that may be contained in this report, independent advice ought to be sought from a financial adviser regarding the suitability of the investment product, taking into account your specific investment objectives, financial situation or particular needs.
StoneX Financial Pte. Ltd., may distribute reports produced by its respective foreign entities or affiliates within the StoneX group of companies or third parties pursuant to an arrangement under Regulation 32C of the Financial Advisers Regulations. Where the report is distributed to a person in Singapore who is not an accredited investor, expert investor or an institutional investor (as defined in the Securities Futures Act), StoneX Financial Pte. Ltd. accepts legal responsibility to such persons for the contents of the report only to the extent required by law. Singapore recipients should contact StoneX Financial Pte. Ltd. at 6826 9988 for matters arising from, or in connection with the report.
In the case of all other recipients of this report, to the extent permitted by applicable laws and regulations neither StoneX Financial Pte. Ltd. nor its associated companies will be responsible or liable for any loss or damage incurred arising out of, or in connection with, any use of the information contained in this report and all such liability is hereby expressly disclaimed. No representation or warranty is made, express or implied, that the content of this report is complete or accurate.
StoneX Financial Pte. Ltd. is not under any obligation to update this report.
Trading CFDs carries a high level of risk that may not be suitable for some investors. Consider your investment objectives, level of experience, financial resources, risk appetite and other relevant circumstances carefully. The possibility exists that you could lose some or all of your investments, including your initial deposits. If in doubt, please seek independent expert advice. Visit www.forex.com/en-sg/terms-and-policies for the complete Risk Disclosure Statement.