


British Pound Outlook: GBP/USD, GBP/AUD Face UK Jobs Test
Sterling faces a UK jobs test as GBP/USD and GBP/AUD show signs of vulnerability despite more supportive BoE rate expectations.
Share this:

The interest rate backdrop has swung in sterling’s favour this year, with markets moving from pricing further BoE easing towards the prospect of renewed tightening. Yet GBP/USD and GBP/AUD are showing signs of vulnerability ahead of UK employment data, which could test whether that shift in rate expectations is justified.
View related analysis:
GBP/USD, GBP/AUD Face UK Jobs Test as BoE Rate Bets Shift
BoE Rate Expectations Swing in Sterling’s Favour
The interest rate outlook has swung in sterling’s favour this year, with money markets moving from pricing further Bank of England easing to the prospect of renewed tightening.
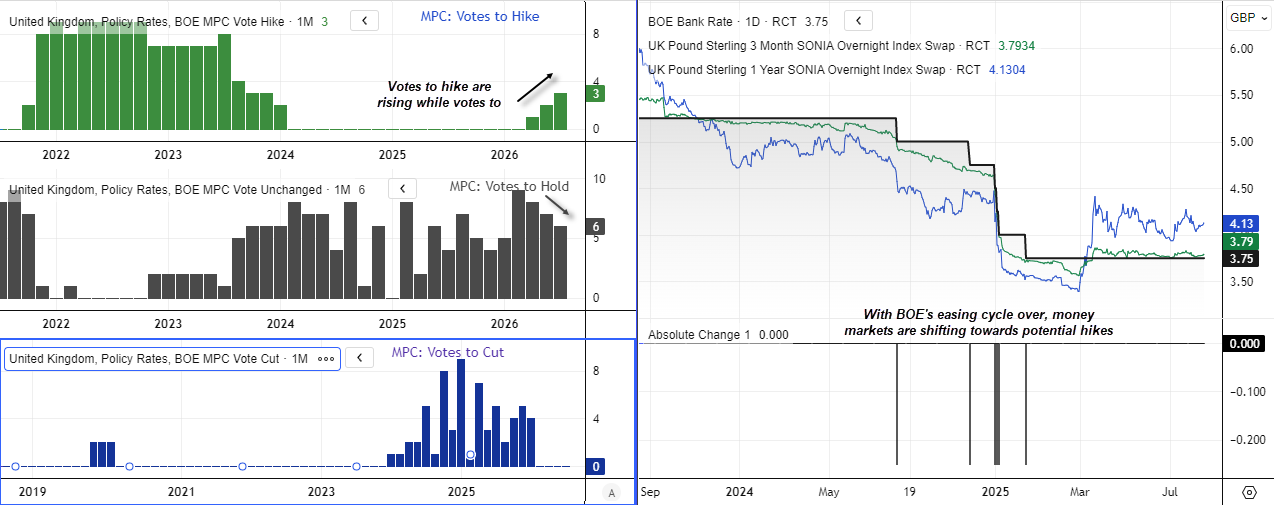
The Bank of England’s cash rate sits at 3.75%, with 3-month SONIA at 3.79% signalling little urgency for an immediate policy change. However, 1-year SONIA is notably higher at 4.13%, pointing to expectations for higher rates over the coming year.
That marks a sharp shift from earlier this year, when markets were positioned for further easing. The shift is also evident within the MPC, with three members voting to raise rates at the latest meeting, up from none earlier this year. Six voted to hold and none backed a cut.
Source: BOE, LSEG
UK Jobs Data Could Test Sterling’s Rate Support
With 1-year SONIA now holding around 4.0–4.2%, the interest rate backdrop has become more supportive for sterling, even if policymakers are expected to remain patient in the near term.
Yet this also leaves the pound vulnerable if incoming data fail to justify those expectations. The UK labour market remains a potential weak spot, with softer employment or wage figures potentially challenging the shift in SONIA pricing and weighing on sterling.


GBP/USD Technical Analysis: British Pound vs US Dollar
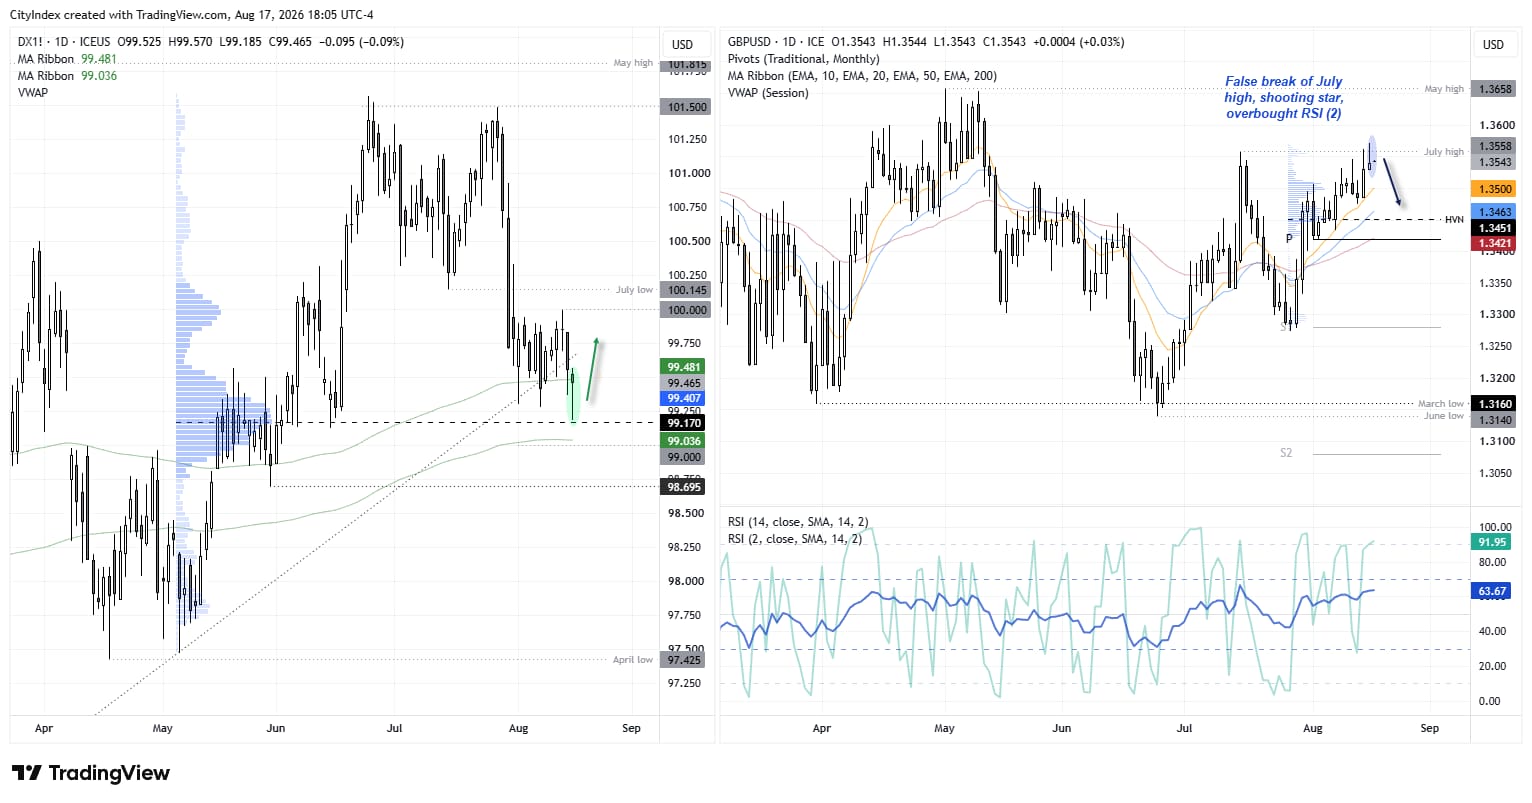
Today’s employment report could come at an interesting juncture for GBP/USD if it comes in weak. A shooting star candle formed on Monday, with a false, intraday break of the June high. With the US dollar index holding above support despite bearish sentiment towards it, I am on guard for a countertrend bounce for the US dollar.
I am not seeking a particularly large bearish move, but with price action showing bearish clues with the US dollar at support, a pullback could be on the cards. Note that the 50-day EMA is near the monthly pivot point just above 1.34. Though a high-volume node also sits at 1.3451 for potential support.
Source: ICE, TradingView
GBP/AUD Technical Analysis: British Pound vs Australian Dollar
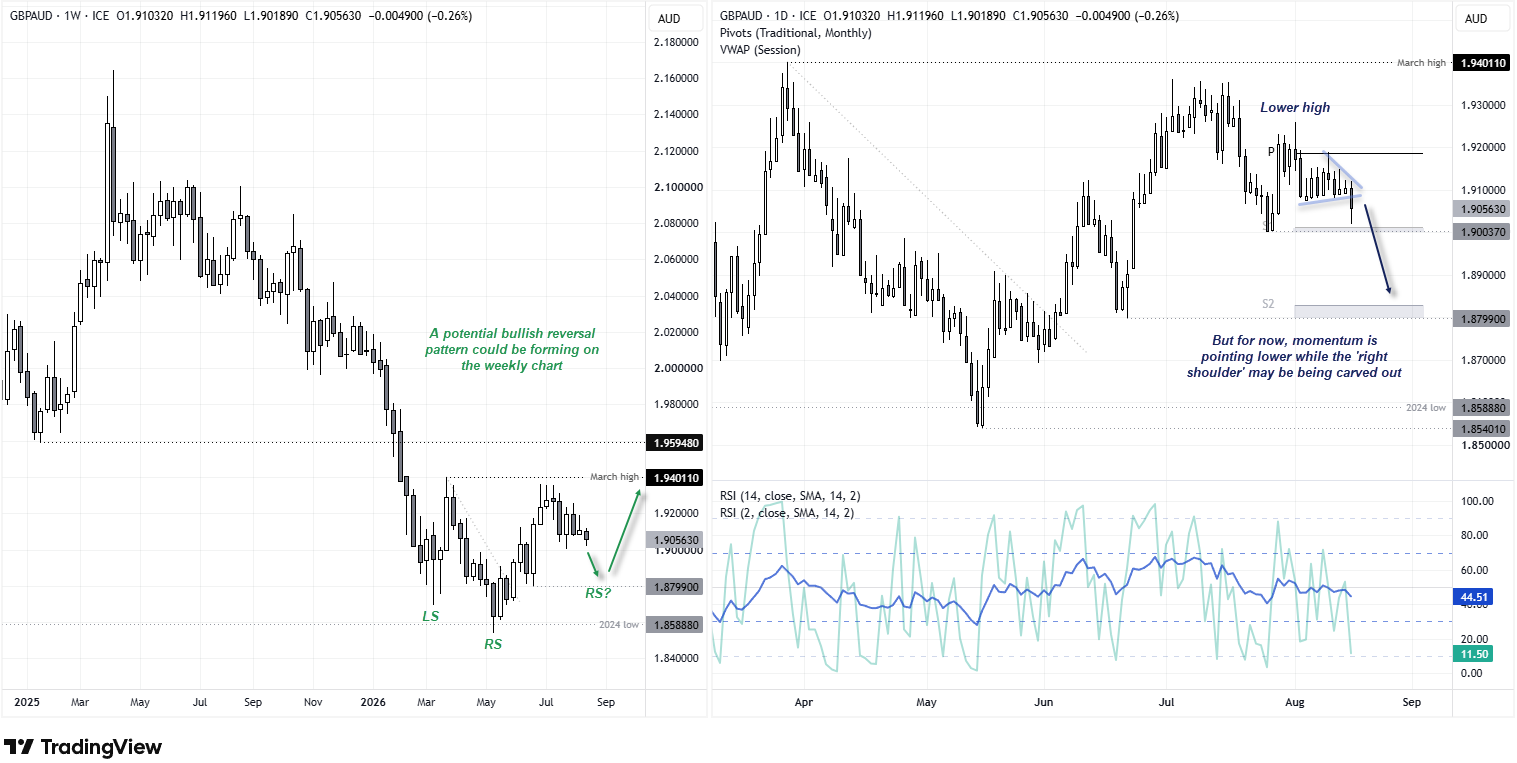
I have been patiently watching the tight consolidation for GBP/AUD in hope that the market tips its hand. And Monday’s bearish breakout may have done just that. The daily chart on the right shows prices are trading within a tightening compression pattern around 1.91, though bears clearly took control to send GBP/AUD down to a 14-week low. While the July low, monthly S1 pivot and 1.90 handle are providing support for now, a break beneath it could open up a run for the 1.89 handle and monthly S2 pivot, near the 1.880 low. And a weak employment report could be a potential trigger for its next leg lower. Conversely, a surprise upside set of jobs figures could held the British pound recover on the back of refreshed BOE hike bets. But for now, my bias is to the downside.
This content was created by an affiliate of FOREX.com and represents the views and opinions of the author/speakers, not the views and opinions of FOREX.com, StoneX Group Inc., or its subsidiaries. The content has not been independently reviewed by FOREX.com.
GBP/AUD Weekly Chart Hints at a Potential Bullish Reversal
Further out, we also have a potential bullish reversal pattern to monitor on the weekly timeframe. It appears that an inverted head and shoulders reversal could be forming, which could mean the current pullback is part of the right shoulder. If we find that a prominent swing low forms above 1.88 on the daily chart, we can reconsider the potential for the ‘right shoulder’ to have formed as part of the H&S pattern. For now, I am focusing on how prices react around 1.90.
Source: ICE, TradingView
View the full economic calendar
-- Written by Matt Simpson
Follow Matt on Twitter @cLeverEdge
Related tags:
Latest market news




Open an account in minutes
Experience award-winning platforms with fast and secure execution, and enjoy tight spreads from 0.5 pts on FX and 0.3 pts on indices.
Economic calendar
Web Trader platform
Our sophisticated web-based platform is packed with features.
Related articles
USD/CHF Feels the Weight of US Midterms, USD/CAD Clings to Support
US midterms threaten fresh dollar volatility as USD/CHF tests technical support and USD/CAD clings to 1.3940 ahead of election results.
AUD/USD Weekly Outlook: RBA Hike, US Midterms and NFP Collide
AUD/USD faces a pivotal week as an expected RBA hike, US midterm elections and nonfarm payrolls test the Australian dollar's recovery.

ASX 200 Outlook: Retailers Signal Consumer Strain Ahead of RBA
ASX 200 futures approach 9,000 despite a sharp retail selloff. Weakening consumer demand and elevated inflation complicate the outlook ahead of the RBA.
This report is intended for general circulation only. It should not be construed as a recommendation, or an offer (or solicitation of an offer) to buy or sell any financial products. The information provided does not take into account your specific investment objectives, financial situation or particular needs. Before you act on any recommendation that may be contained in this report, independent advice ought to be sought from a financial adviser regarding the suitability of the investment product, taking into account your specific investment objectives, financial situation or particular needs.
StoneX Financial Pte. Ltd., may distribute reports produced by its respective foreign entities or affiliates within the StoneX group of companies or third parties pursuant to an arrangement under Regulation 32C of the Financial Advisers Regulations. Where the report is distributed to a person in Singapore who is not an accredited investor, expert investor or an institutional investor (as defined in the Securities Futures Act), StoneX Financial Pte. Ltd. accepts legal responsibility to such persons for the contents of the report only to the extent required by law. Singapore recipients should contact StoneX Financial Pte. Ltd. at 6826 9988 for matters arising from, or in connection with the report.
In the case of all other recipients of this report, to the extent permitted by applicable laws and regulations neither StoneX Financial Pte. Ltd. nor its associated companies will be responsible or liable for any loss or damage incurred arising out of, or in connection with, any use of the information contained in this report and all such liability is hereby expressly disclaimed. No representation or warranty is made, express or implied, that the content of this report is complete or accurate.
StoneX Financial Pte. Ltd. is not under any obligation to update this report.
Trading CFDs carries a high level of risk that may not be suitable for some investors. Consider your investment objectives, level of experience, financial resources, risk appetite and other relevant circumstances carefully. The possibility exists that you could lose some or all of your investments, including your initial deposits. If in doubt, please seek independent expert advice. Visit www.forex.com/en-sg/terms-and-policies for the complete Risk Disclosure Statement.