



Gold Price Outlook: Speed Bump Seems Unlikely to Deter Dip Mentality
Gold has wobbled after its breakout, but bullish positioning and options signals suggest dip buying could remain supportive.
Share this:

Throughout July, I had been noting the repeated failed attempts from gold bears to sustain a break below 4,000. And when a level won’t budge, the market has a tendency to eventually go the other way.
Last Tuesday, August 4, I outlined a case for a breakout, arguing that price action, options pricing and futures sentiment all hinted at quiet accumulation. Maybe I got lucky with the timing, but the breakout on August 5 was spectacular, to say the least, with gold rising 5% to mark its best day since February and its second-best day in ten years.
While I suspect gold bulls have more planned, price action on Thursday shows prices have wobbled at their cycle high, hinting at the first bump in the road.
View related analysis:
- Gold Price Outlook: Can Quiet Accumulation Trigger a Breakout?
- ASX 200 Outlook: Potential Bull Flag Forms Beneath Record Highs
- US Dollar Bounce Looks Vulnerable, EUR/USD Respects Resistance for Now
- Japanese Yen Outlook: US CPI, Intervention Risks Put USD/JPY Bulls on Notice
- FX Futures Positioning: US Dollar Longs Plunged, Yen Shorts Slashed
View related analysis:
- Gold Price Outlook: Can Quiet Accumulation Trigger a Breakout?
- ASX 200 Outlook: Potential Bull Flag Forms Beneath Record Highs
- US Dollar Bounce Looks Vulnerable, EUR/USD Respects Resistance for Now
- Japanese Yen Outlook: US CPI, Intervention Risks Put USD/JPY Bulls on Notice
- FX Futures Positioning: US Dollar Longs Plunged, Yen Shorts Slashed
Gold Wobbles, but ‘Dip’ Mentality Could Remain
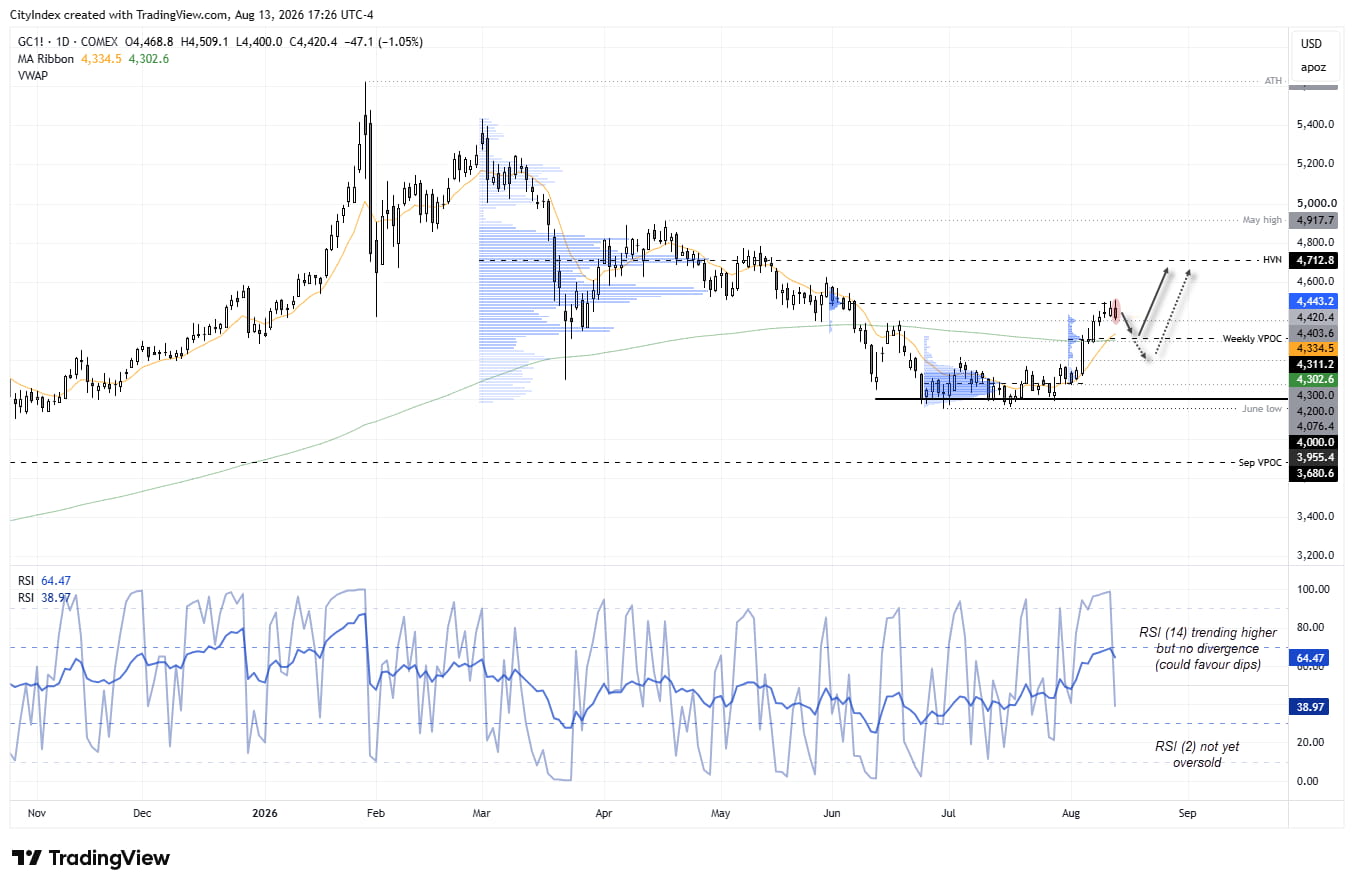
The daily chart shows a solid rally from 4,000 support, although resistance was met around a prior weekly VPOC (volume point of control), just below 4,500. A bearish outside day engulfed Tuesday’s small doji and Wednesday’s small bullish candle, but so far, support has held around 4,400, close to the weekly VPOC at 4,404.
A break beneath this area would bring the 200-day EMA into focus near 4,300, along with the lower end of the recent trading range. If we see bears take full control, the next level they could potentially target is around 4,200, near the recent range lows.
However, given the strength of the bullish range expansion after a prolonged period of consolidation above 4,000, my bias remains for a move towards 4,700, with 4,600 likely to provide interim resistance along the way should the rally continue. Moreover, futures and options sentiment also appears supportive of a “buy the dip” mentality among gold bulls, some of whom may be frustrated at having missed the initial burst higher.
Source: COMEX, TradingView
Gold Price Outlook: Futures Positioning and Options Signals
Gold Futures (GC) Positioning | COT Report
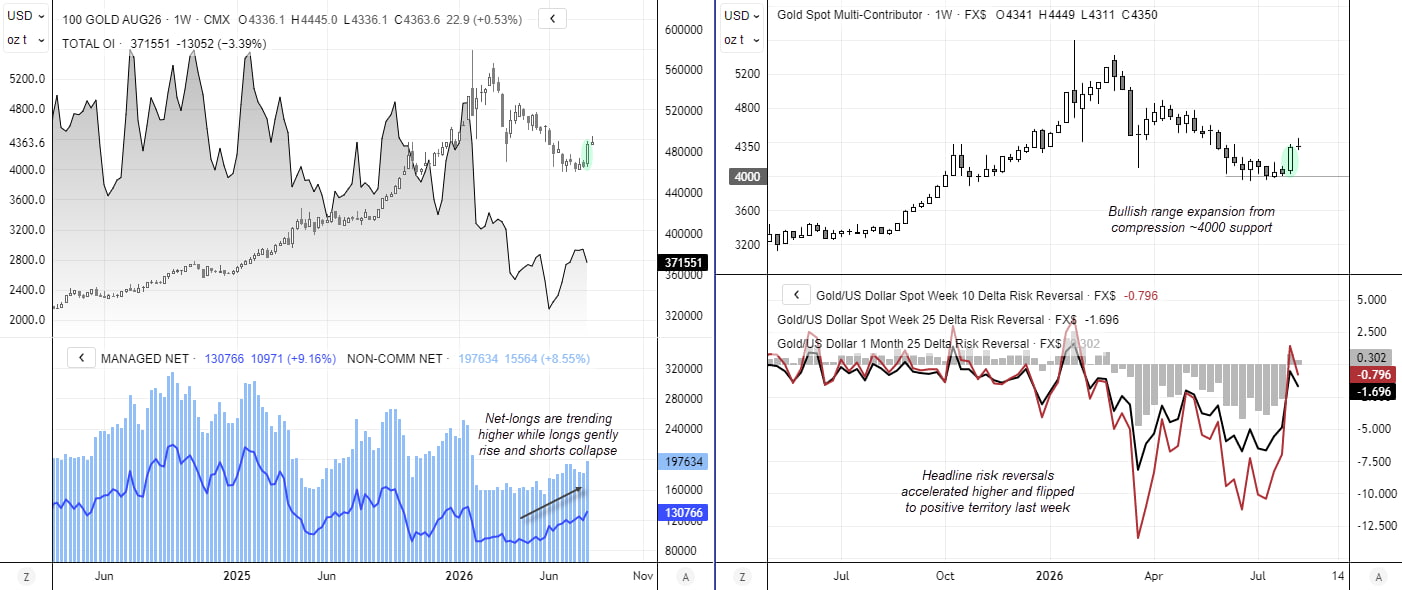
Net-long exposure has continued to trend higher to gold futures, among large speculators and managed funds managers. Recent data from the weekly Commitment of Traders (COT) report shows funds had a net-long exposure of 131k contracts, their most bullish level in more than six months. Large specs pushed their net-long exposure to a 6-month high just shy of 200k. While gross-longs have been trending gradually higher, it is the collapse of short bets that helped propel net-longs in recent weeks. And I suspect that will continue to be a supporting feature for higher gold prices, with a lack of bearish interest for now.
This content was created by an affiliate of FOREX.com and represents the views and opinions of the author/speakers, not the views and opinions of FOREX.com, StoneX Group Inc., or its subsidiaries. The content has not been independently reviewed by FOREX.com.
Gold Options Positioning Signals Cautious Bullishness
Two of the three risk reversals I track had flipped into positive territory last week, for the first time since mid-April. This showed that demand for calls outnumbers demand for puts. But we also saw the risk reversals accelerate from low levels ahead of the breakout to show options traders quickly moving away from downside protection relative to bullish bets. The fact it has dipped to negative territory this week is not enough to call for a major swing high in my books, but it does back up the potential for a minor pullback over the near term
Source: ICE, TradingView
View the full economic calendar
View the full economic calendar
-- Written by Matt Simpson
Follow Matt on Twitter @cLeverEdge
How to trade with City Index
You can trade with City Index by following these four easy steps:
- Open an account, or log in if you’re already a customer
• Open an account in the UK
• Open an account in Australia
• Open an account in Singapore
- Search for the market you want to trade in our award-winning platform
- Choose your position and size, and your stop and limit levels
- Place the trade
Related tags:
Latest market news




Open an account in minutes
Experience award-winning platforms with fast and secure execution, and enjoy tight spreads from 0.5 pts on FX and 0.3 pts on indices.
Economic calendar
Web Trader platform
Our sophisticated web-based platform is packed with features.
Related articles
Canadian Dollar Short-term Outlook: USD/CAD Five-Week Rally Hits a Wall at Major Resistance 10 14 2026
USD/CAD is holding near fresh yearly highs, but bearish divergence and a well-defined October range raise the stakes at major resistance.
USD/JPY forecast: hot US CPI lifts the pair above its 200-day average
Hotter-than-expected US inflation has pushed USD/JPY above its 200-day moving average, putting 160 and the risk of Bank of Japan intervention back in focus. The breakout still needs to hold, and a failure could send the pair sharply lower.


Dow Jones outlook: CPI, oil and yields put the rally to the test
US index futures rebounded in the first half of Wednesday’s session, along with European indices ahead of the release of US CPI. Some slightly dovish remarks from the Fed’s Williams seem to have helped sentiment a little, but whether those comments will be backed by data remains to be seen. While slightly hotter than expected inflation data shouldn’t be enough for markets to price in an October Fed hike with more than a coin flip probability, it can nonetheless reinforce expectations of further tightening later in the year.
This report is intended for general circulation only. It should not be construed as a recommendation, or an offer (or solicitation of an offer) to buy or sell any financial products. The information provided does not take into account your specific investment objectives, financial situation or particular needs. Before you act on any recommendation that may be contained in this report, independent advice ought to be sought from a financial adviser regarding the suitability of the investment product, taking into account your specific investment objectives, financial situation or particular needs.
StoneX Financial Pte. Ltd., may distribute reports produced by its respective foreign entities or affiliates within the StoneX group of companies or third parties pursuant to an arrangement under Regulation 32C of the Financial Advisers Regulations. Where the report is distributed to a person in Singapore who is not an accredited investor, expert investor or an institutional investor (as defined in the Securities Futures Act), StoneX Financial Pte. Ltd. accepts legal responsibility to such persons for the contents of the report only to the extent required by law. Singapore recipients should contact StoneX Financial Pte. Ltd. at 6826 9988 for matters arising from, or in connection with the report.
In the case of all other recipients of this report, to the extent permitted by applicable laws and regulations neither StoneX Financial Pte. Ltd. nor its associated companies will be responsible or liable for any loss or damage incurred arising out of, or in connection with, any use of the information contained in this report and all such liability is hereby expressly disclaimed. No representation or warranty is made, express or implied, that the content of this report is complete or accurate.
StoneX Financial Pte. Ltd. is not under any obligation to update this report.
Trading CFDs carries a high level of risk that may not be suitable for some investors. Consider your investment objectives, level of experience, financial resources, risk appetite and other relevant circumstances carefully. The possibility exists that you could lose some or all of your investments, including your initial deposits. If in doubt, please seek independent expert advice. Visit www.forex.com/en-sg/terms-and-policies for the complete Risk Disclosure Statement.