



CAD/JPY Outlook Ahead of Canada Jobs and Trump Tariff Ruling
CAD/JPY trades near cycle highs as Canada jobs data and a looming US Supreme Court ruling on Trump’s tariffs shape near-term risk.
Share this:

The Canadian dollar has come under renewed selling pressure this week, weighed down by softer domestic economic data and its sensitivity to oil prices following the US takeover of Venezuela. At the same time, the Japanese yen has attracted safe-haven demand ahead of a US Supreme Court ruling on Trump’s tariffs. With no guarantee a decision is delivered before Friday’s close, the risk of weekend gaps or follow-through moves into next week remains elevated.
View related analysis:
View related analysis:
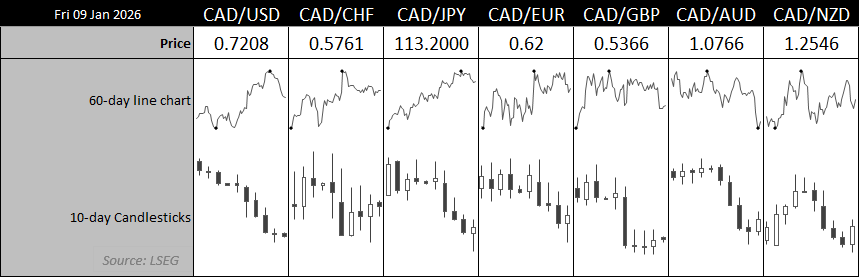
Chart prepared by Matt Simpson - Source: LSEG
CAD/JPY Outlook Ahead of Canada Jobs Data and Trump Tariff Decision
My base case is that tariffs are either upheld or kicked back to Congress, with the probability of them being ruled illegal relatively low. Markets have already adjusted to a tariff-inclusive backdrop, meaning any knee-jerk risk-off reaction should be limited before broader trends reassert themselves. A ruling that strikes tariffs down outright would be the true outlier, potentially triggering a sharp risk-on response as markets price freer trade and unwind parts of Trump’s tariff framework. For now, the balance of risks keeps CAD/JPY vulnerable rather than signalling a full trend reversal.
Traders should also be mindful that Canada’s employment report is released alongside US nonfarm payrolls today, increasing the risk of heightened volatility in CAD/JPY. Even so, it may not take much of a positive surprise to stabilise the Canadian dollar into the weekend, given the pair has already retraced around 1.6% from its cycle highs. A corrective bounce into next week therefore remains a plausible scenario.


CAD/JPY Technical Analysis: Canadian Dollar vs Japanese Yen
The daily chart shows CAD/JPY printed an indecision candle on Thursday around the 113 handle, close to its monthly pivot point and the high-volume node (HVN) from December’s consolidation range. With the daily RSI (2) deeply oversold at the close, the near-term bias favours at least a modest rebound.
The 114 handle, near the 114.23 HVN, may act as an initial upside target for bulls. A broader risk-on backdrop next week could reopen the door to a push toward cycle highs. That said, bearish signals on the weekly timeframe suggest any upside is more likely corrective unless momentum improves decisively.
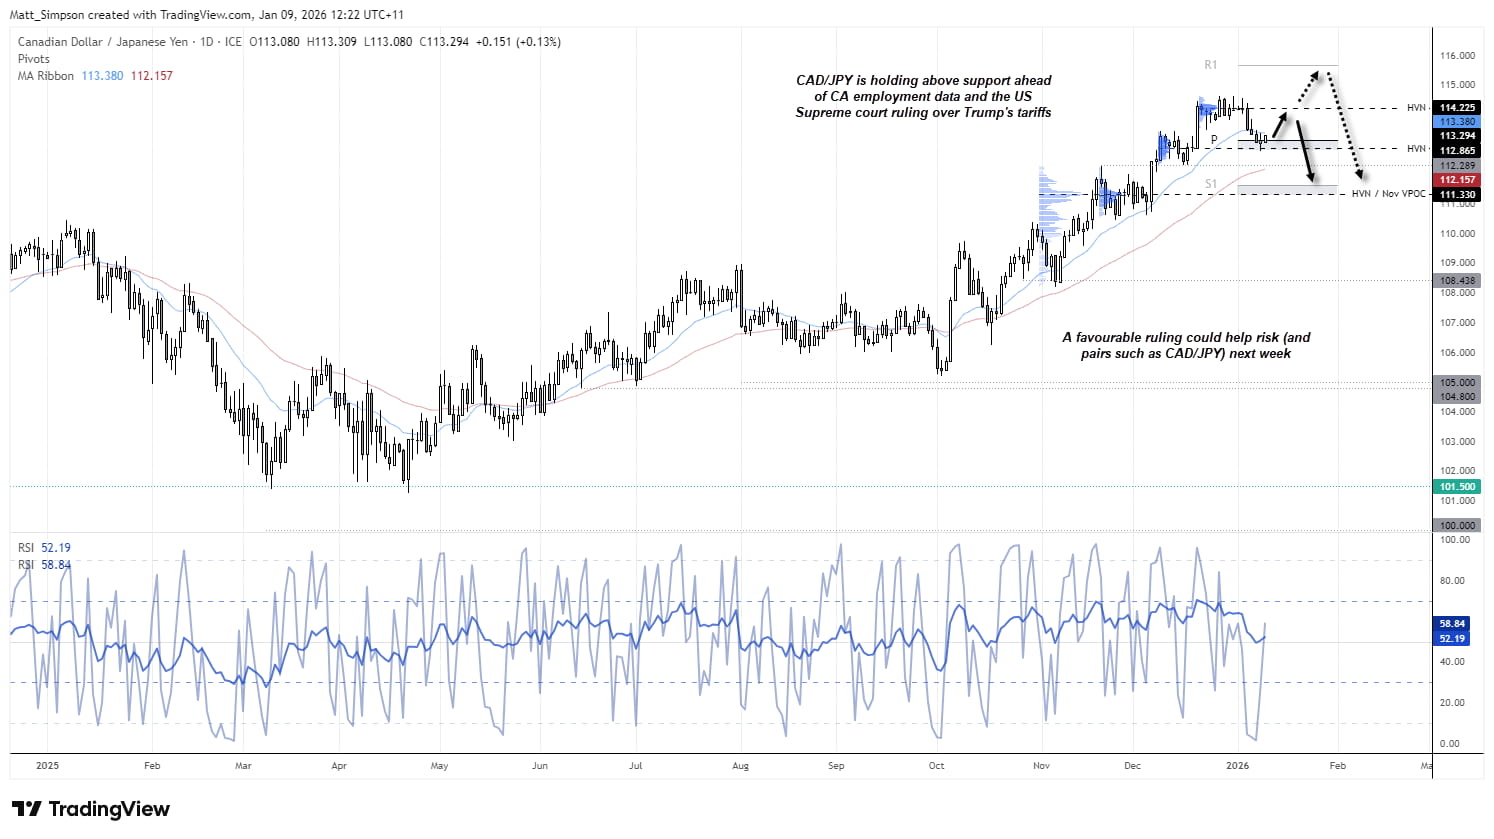
Chart analysis by Matt Simpson - Source: TradingView
CAD/JPY Technical Analysis: Weekly Perspective
The Canadian dollar enjoyed a strong rally against the Japanese yen in Q4, though mean reversion has since taken hold. CAD/JPY is on track for its second consecutive weekly decline after last week’s bearish inside week flagged hesitation near the highs. RSI readings were also overbought at the cycle peak, with prices extended above their short-term moving averages.
A deeper pullback toward the 2024 high at 111.56, near monthly S1, cannot be ruled out. However, a decisive break below this level would likely require renewed optimism around Bank of Japan rate hikes alongside a genuine risk-off shock — such as Trump’s tariffs being struck down outright. For now, the pullback looks more like a healthy correction within a broader uptrend.

Chart analysis by Matt Simpson - Source: TradingView
View the full economic calendar
View the full economic calendar
-- Written by Matt Simpson
Follow Matt on Twitter @cLeverEdge
How to trade with City Index
You can trade with City Index by following these four easy steps:
- Open an account, or log in if you’re already a customer
• Open an account in the UK
• Open an account in Australia
• Open an account in Singapore
- Search for the market you want to trade in our award-winning platform
- Choose your position and size, and your stop and limit levels
- Place the trade
Related tags:
Latest market news




Open an account in minutes
Experience award-winning platforms with fast and secure execution, and enjoy tight spreads from 0.5 pts on FX and 0.3 pts on indices.
Economic calendar
Web Trader platform
Our sophisticated web-based platform is packed with features.
Related articles
This report is intended for general circulation only. It should not be construed as a recommendation, or an offer (or solicitation of an offer) to buy or sell any financial products. The information provided does not take into account your specific investment objectives, financial situation or particular needs. Before you act on any recommendation that may be contained in this report, independent advice ought to be sought from a financial adviser regarding the suitability of the investment product, taking into account your specific investment objectives, financial situation or particular needs.
StoneX Financial Pte. Ltd., may distribute reports produced by its respective foreign entities or affiliates within the StoneX group of companies or third parties pursuant to an arrangement under Regulation 32C of the Financial Advisers Regulations. Where the report is distributed to a person in Singapore who is not an accredited investor, expert investor or an institutional investor (as defined in the Securities Futures Act), StoneX Financial Pte. Ltd. accepts legal responsibility to such persons for the contents of the report only to the extent required by law. Singapore recipients should contact StoneX Financial Pte. Ltd. at 6826 9988 for matters arising from, or in connection with the report.
In the case of all other recipients of this report, to the extent permitted by applicable laws and regulations neither StoneX Financial Pte. Ltd. nor its associated companies will be responsible or liable for any loss or damage incurred arising out of, or in connection with, any use of the information contained in this report and all such liability is hereby expressly disclaimed. No representation or warranty is made, express or implied, that the content of this report is complete or accurate.
StoneX Financial Pte. Ltd. is not under any obligation to update this report.
Trading CFDs carries a high level of risk that may not be suitable for some investors. Consider your investment objectives, level of experience, financial resources, risk appetite and other relevant circumstances carefully. The possibility exists that you could lose some or all of your investments, including your initial deposits. If in doubt, please seek independent expert advice. Visit www.forex.com/en-sg/terms-and-policies for the complete Risk Disclosure Statement.