





Canadian Dollar Forecast: Has USD/CAD Topped? Part II
U.S. Dollar bulls failed to drive a pullback and USD/CAD remains heavy after the pair reverted into its long-term range.
Share this:

Canadian Dollar, USD/CAD Talking Points:
- USD/CAD was looking vulnerable in February as trade war themes were pricing-in to macro markets, but a couple months later the long-term range in USD/CAD has so far prevailed.
- In February, just a few weeks after the breakout, I asked if USD/CAD had topped, and now a couple of months later, that looks more and more to have been the case.
- Last week brought an aggressive push below the 1.4000 handle and that was a big move from bears. The fact that sellers did not relent in the following week illustrates a continued show of control.
You can often find out the most important information in unfriendly environments, and this statement can be spanned from personal relationships to market dynamics.
Like the old saying goes, you find out who’s your friend in the bad times; well, markets, too, will tend to show you the dominant or most important trends when conditions run counter to their aim. If bulls show up to defend support at a higher-low, for instance, that can be read as a sign of optimism from buyers even after a seemingly pessimistic showing in the market (producing the pullback). Or, if bulls have an open door to run a breakout to another fresh all-time-high, and, suddenly, they fail or back down, and then allow for sellers to take over; well, that can be akin to that friend that doesn’t answer your phone call when you reach out in distress.
You can find out what someone or something is really made of when times are tough.
In USD/CAD bears showed up in February and as I asked a few weeks after the failed breakout, ‘Has USD/CAD Topped?’ Now, a couple months later, it looks more and more like that has been the case, especially considering how quickly the rally in USD and DXY has been re-framed around trade tariff fears.
On the daily chart of USD/CAD, we can see that continued progression of lower-lows and lower-highs. The 1.4500 level held resistance on two occasions in March, and already the 1.4000 level has been broken through in April.
In last week’s USD/CAD article, I highlighted support at 1.3846 which, as of this writing, has held. But I also pointed out the importance of resistance at 1.4000, and as I said then, ideally bears would show a bit of anticipation before the big figure came into play and I drew up a zone from 1.3980-1.4000. The high for this week has been 1.3978 so sellers came in two pips shy of that zone to hold the weekly high.
USD/CAD Daily Chart
 Chart prepared by James Stanley; data derived from Tradingview
USD/CAD
The weekly bar at this point is somewhat indecisive. I’m writing this article on the Thursday before Good Friday which presents some challenge, as spot FX markets are not closed tomorrow while many futures markets are. That opens the possibility of low liquidity which, if met with some headline on tariffs, can produce high levels of volatility. Interestingly, this is somewhat similar to the backdrop that led to the breakout in early-February as it was a low liquidity backdrop on a Sunday open that allowed for the bullish breakout to take-hold, but that wasn’t a holiday and it was a widely-expected tariff date. I highlighted the possibility of pandemonium ahead of that event then and that’s what played out. I hesitate to assume the weekly close at this spot on the chart given that we could see some change if comments from Trump come out in a pointed manner on the tariff topic.
USD/CAD Weekly Price Chart
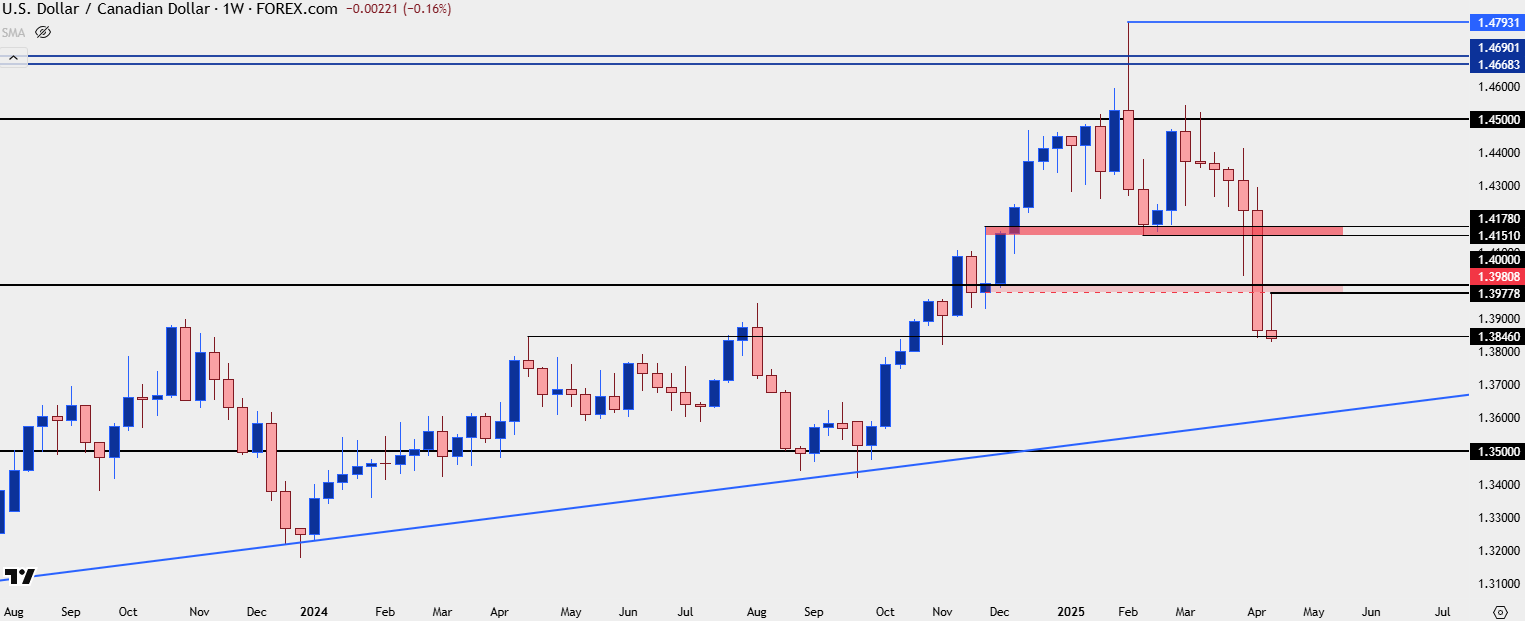 Chart prepared by James Stanley; data derived from Tradingview
With that said, the broader bearish trend now has some context. The 1.4000 area remains a viable spot of resistance potential and above that, the 1.4151-1.4178 area is still of note. As I said in the weekend video on USD, I consider USD/CAD to be one of the more attractive major pairs for USD-weakness scenarios.
USD/CAD Monthly
The monthly chart highlights the broader range that’s been in-force for the past nine years, and while February showed stall and March showed sellers getting a bit more aggressive with the lower-highs at 1.4500, it was the first-half of April when sellers really made their mark. The 1.3846 level that’s currently holding the lows also becomes visible as it was resistance at multiple points in 2024 before becoming support later in the year. The 1.3500 level is the next significant psychological level below current price and this was in-play ahead of the election in September, helping to establish a morning star formation that ran into the early-2025 breakout.
This is the perspective with which topping potential looks most attractive as price has simply moved back into the same range that’s held in the pair since 2016, and as can be seen in 2016 or 2017 or again in 2020-2021, when the longer-term range fills in there could be significant opportunity for trends on a shorter-term basis.
USD/CAD Monthly Price Chart
 Chart prepared by James Stanley; data derived from Tradingview
--- written by James Stanley, Senior Strategist
Canadian Dollar, USD/CAD Talking Points:
- USD/CAD was looking vulnerable in February as trade war themes were pricing-in to macro markets, but a couple months later the long-term range in USD/CAD has so far prevailed.
- In February, just a few weeks after the breakout, I asked if USD/CAD had topped, and now a couple of months later, that looks more and more to have been the case.
- Last week brought an aggressive push below the 1.4000 handle and that was a big move from bears. The fact that sellers did not relent in the following week illustrates a continued show of control.
You can often find out the most important information in unfriendly environments, and this statement can be spanned from personal relationships to market dynamics.
Like the old saying goes, you find out who’s your friend in the bad times; well, markets, too, will tend to show you the dominant or most important trends when conditions run counter to their aim. If bulls show up to defend support at a higher-low, for instance, that can be read as a sign of optimism from buyers even after a seemingly pessimistic showing in the market (producing the pullback). Or, if bulls have an open door to run a breakout to another fresh all-time-high, and, suddenly, they fail or back down, and then allow for sellers to take over; well, that can be akin to that friend that doesn’t answer your phone call when you reach out in distress.
You can find out what someone or something is really made of when times are tough.
In USD/CAD bears showed up in February and as I asked a few weeks after the failed breakout, ‘Has USD/CAD Topped?’ Now, a couple months later, it looks more and more like that has been the case, especially considering how quickly the rally in USD and DXY has been re-framed around trade tariff fears.
On the daily chart of USD/CAD, we can see that continued progression of lower-lows and lower-highs. The 1.4500 level held resistance on two occasions in March, and already the 1.4000 level has been broken through in April.
In last week’s USD/CAD article, I highlighted support at 1.3846 which, as of this writing, has held. But I also pointed out the importance of resistance at 1.4000, and as I said then, ideally bears would show a bit of anticipation before the big figure came into play and I drew up a zone from 1.3980-1.4000. The high for this week has been 1.3978 so sellers came in two pips shy of that zone to hold the weekly high.
USD/CAD Daily Chart
Chart prepared by James Stanley; data derived from Tradingview
USD/CAD
The weekly bar at this point is somewhat indecisive. I’m writing this article on the Thursday before Good Friday which presents some challenge, as spot FX markets are not closed tomorrow while many futures markets are. That opens the possibility of low liquidity which, if met with some headline on tariffs, can produce high levels of volatility. Interestingly, this is somewhat similar to the backdrop that led to the breakout in early-February as it was a low liquidity backdrop on a Sunday open that allowed for the bullish breakout to take-hold, but that wasn’t a holiday and it was a widely-expected tariff date. I highlighted the possibility of pandemonium ahead of that event then and that’s what played out. I hesitate to assume the weekly close at this spot on the chart given that we could see some change if comments from Trump come out in a pointed manner on the tariff topic.
USD/CAD Weekly Price Chart
Chart prepared by James Stanley; data derived from Tradingview
With that said, the broader bearish trend now has some context. The 1.4000 area remains a viable spot of resistance potential and above that, the 1.4151-1.4178 area is still of note. As I said in the weekend video on USD, I consider USD/CAD to be one of the more attractive major pairs for USD-weakness scenarios.
USD Video for the Week Ahead
Video link
USD/CAD Monthly
The monthly chart highlights the broader range that’s been in-force for the past nine years, and while February showed stall and March showed sellers getting a bit more aggressive with the lower-highs at 1.4500, it was the first-half of April when sellers really made their mark. The 1.3846 level that’s currently holding the lows also becomes visible as it was resistance at multiple points in 2024 before becoming support later in the year. The 1.3500 level is the next significant psychological level below current price and this was in-play ahead of the election in September, helping to establish a morning star formation that ran into the early-2025 breakout.
This is the perspective with which topping potential looks most attractive as price has simply moved back into the same range that’s held in the pair since 2016, and as can be seen in 2016 or 2017 or again in 2020-2021, when the longer-term range fills in there could be significant opportunity for trends on a shorter-term basis.
USD/CAD Monthly Price Chart
Chart prepared by James Stanley; data derived from Tradingview
--- written by James Stanley, Senior Strategist
Related tags:




Open an account in minutes
Experience award-winning platforms with fast and secure execution, and enjoy tight spreads from 0.5 pts on FX and 0.3 pts on indices.
Economic calendar
Web Trader platform
Our sophisticated web-based platform is packed with features.
Related articles

Gold Does Something it Hasn’t Done in a Year, is Larger Risk-Off Afoot?
With tech stocks getting hit harder last week there was collateral damage elsewhere, including gold as the metal closed below the $4k level for the week and that’s the first time that’s happened to spot gold in more than a year.

US Dollar Price Action Setups: EUR/USD, USD/JPY, GBP/USD, USD/CAD
The Dollar is working on its second consecutive red week and while sellers didn’t exactly pounce on fresh lows, there’s an opening door for bears to make a move.

USD/JPY Sinks to Familiar Support as Risk Off Fears Grow
Stocks are selling off in both the US and Japan and USD/JPY has started to show a degree of strain, with a pullback to a key support level even as USD-strength remains in-force elsewhere.
This report is intended for general circulation only. It should not be construed as a recommendation, or an offer (or solicitation of an offer) to buy or sell any financial products. The information provided does not take into account your specific investment objectives, financial situation or particular needs. Before you act on any recommendation that may be contained in this report, independent advice ought to be sought from a financial adviser regarding the suitability of the investment product, taking into account your specific investment objectives, financial situation or particular needs.
StoneX Financial Pte. Ltd., may distribute reports produced by its respective foreign entities or affiliates within the StoneX group of companies or third parties pursuant to an arrangement under Regulation 32C of the Financial Advisers Regulations. Where the report is distributed to a person in Singapore who is not an accredited investor, expert investor or an institutional investor (as defined in the Securities Futures Act), StoneX Financial Pte. Ltd. accepts legal responsibility to such persons for the contents of the report only to the extent required by law. Singapore recipients should contact StoneX Financial Pte. Ltd. at 6826 9988 for matters arising from, or in connection with the report.
In the case of all other recipients of this report, to the extent permitted by applicable laws and regulations neither StoneX Financial Pte. Ltd. nor its associated companies will be responsible or liable for any loss or damage incurred arising out of, or in connection with, any use of the information contained in this report and all such liability is hereby expressly disclaimed. No representation or warranty is made, express or implied, that the content of this report is complete or accurate.
StoneX Financial Pte. Ltd. is not under any obligation to update this report.
Trading CFDs carries a high level of risk that may not be suitable for some investors. Consider your investment objectives, level of experience, financial resources, risk appetite and other relevant circumstances carefully. The possibility exists that you could lose some or all of your investments, including your initial deposits. If in doubt, please seek independent expert advice. Visit www.forex.com/en-sg/terms-and-policies for the complete Risk Disclosure Statement.