



Canadian Dollar Levels: USD/CAD at Make or Break Support
USD/CAD continues to test the 1.4000 level even as DXY digs down for a fresh low. This is the spot that USD and USD/CAD bulls want to see hold for bullish continuation setups.
Share this:

USD/CAD tagged a fresh six-month high last week and looked ready to rally into the 1.4200 handle. But buyers soon slammed into a brick wall just ten pips inside of a key zone of support-turned-resistance, and that’s led to a pullback so far this week as price hurried down for a test of the 1.4000 psychological level. Four days later, that support is still in-play, even as DXY has grinded down to a fresh low.
USD Themes
The US Dollar pullback is deepening with price pushing down to ‘s2’ support at the 98.98 Fibonacci level, and this happened after an attempted hold at the ‘s1’ level of 99.40 that seemingly failed even as news of agreement to end the government shutdown made its way through markets.
In USD/CAD, however, the pair continues to grasp on to the 1.4000 handle which is a major level in the pair and has been for much of the past decade as the broader range has built in a rather consistent manner. The 1.4000 level was a big spot of resistance back in May, following a bounce from 1.3750 which ultimately came back into play as resistance during the build of the ascending triangle in Q3.
Interestingly, bulls staged a fast breakout above 1.4000 shortly after the Q4 open; but for a major level of that nature it can often take time to gain acceptance, as we’re seeing now.
USD/CAD Daily Chart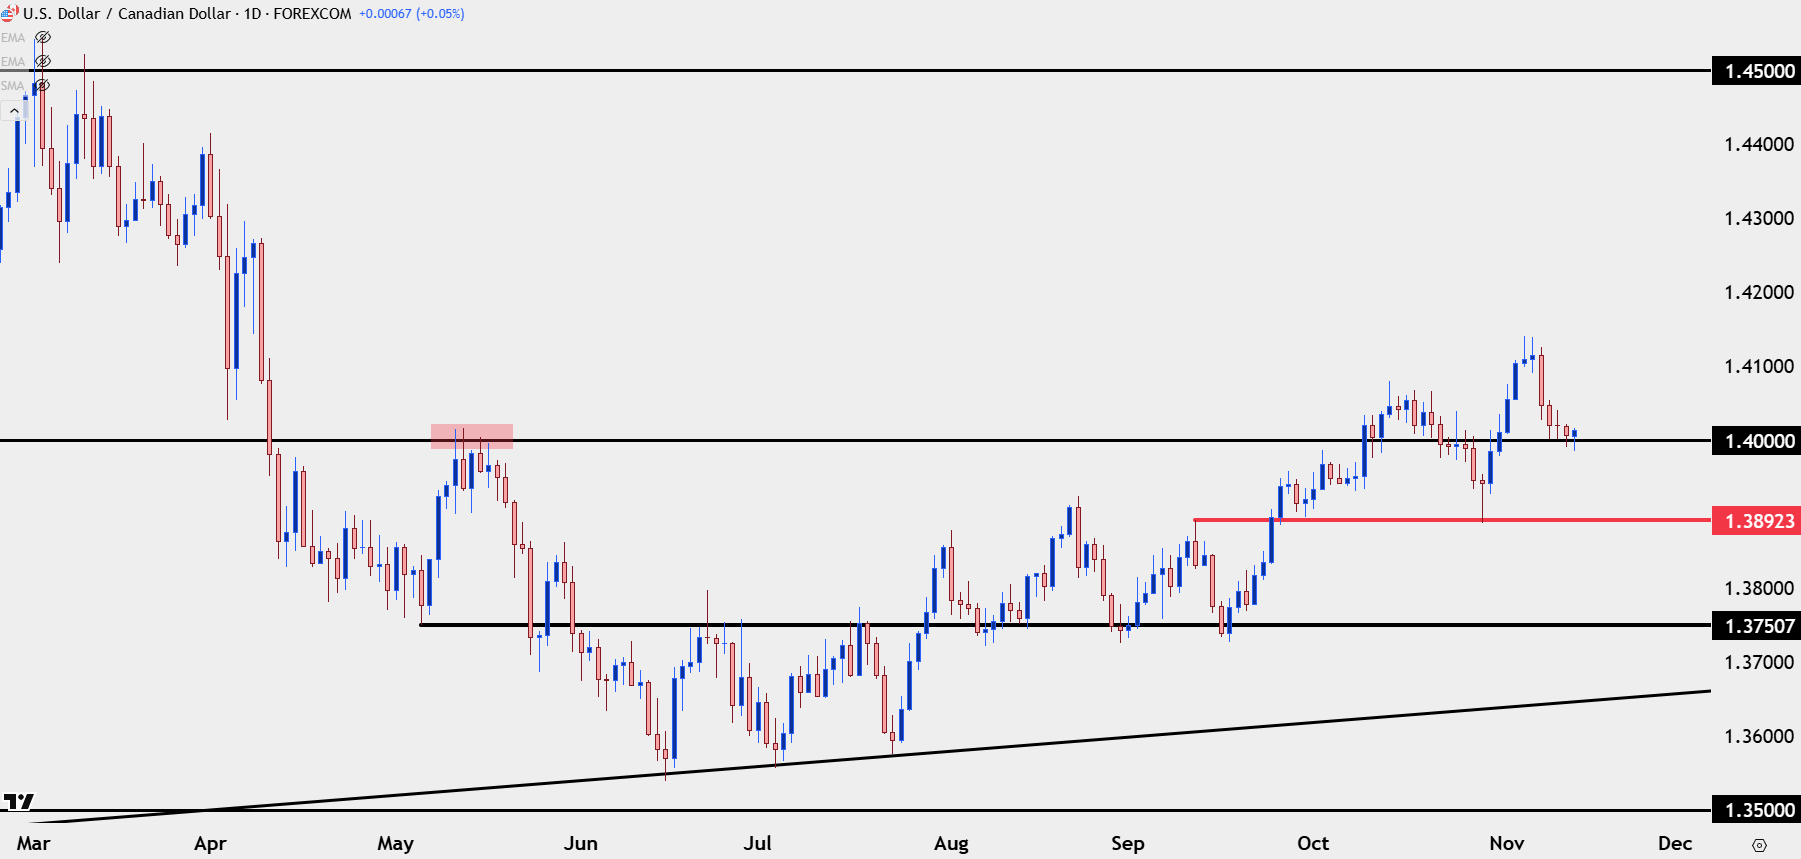
Chart prepared by James Stanley; data derived from Tradingview

USD/CAD Big Picture
Looking at the long-term backdrop of the pair highlights just how important these major psychological levels are and have been. Back in February, when the pair was flying high on the back of the tariff trade, I harped on the 1.4500 level as that was a high water mark for the range over the past nine years. That’s ultimately what helped to stall the rally before the pullback began in March which turned into a short-term reversal in April.
These longer-term dynamics bear importance on the shorter-term backdrop, as a continuation of the current trend above 1.4000 would seemingly open the door to a run up towards longer-term resistance, even if there is minimized expectation of a long-term break of the range at 1.4500.
This monthly chart also illustrates the importance of the resistance ahead, around the 1.4151-1.4178 zone which is a zone of resistance-turned support from November to February, and this is what calmed the bullish breakout last week as that zone came closer.
USD/CAD Monthly Chart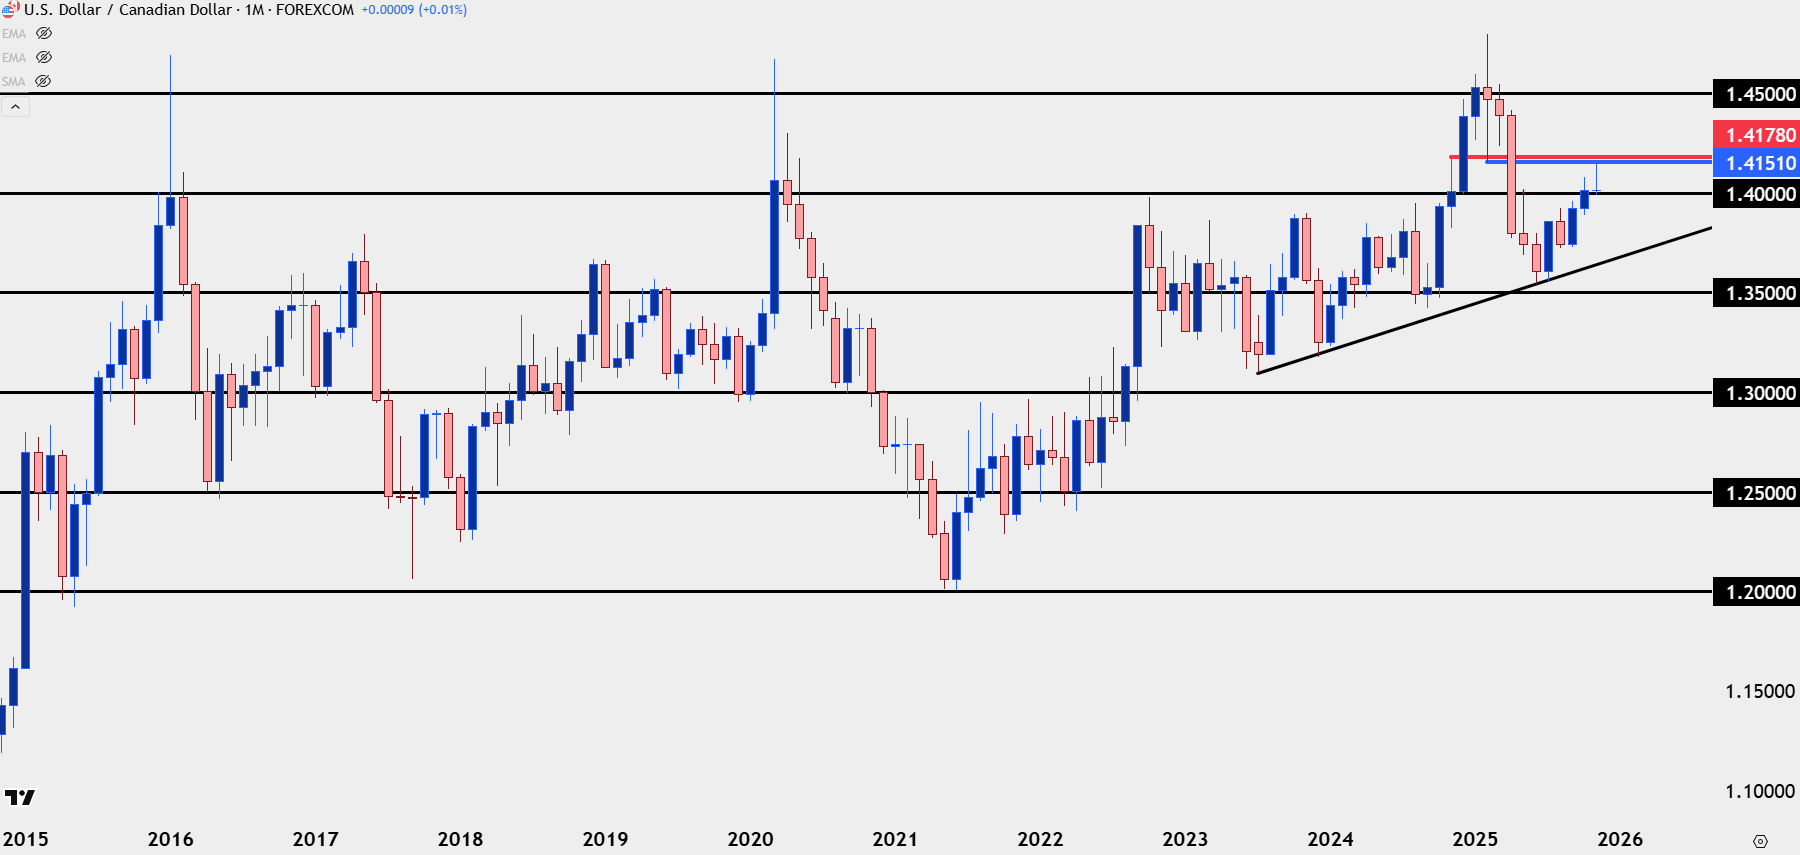
Chart prepared by James Stanley; data derived from Tradingview
USD/CAD: Levels and Strategy
In webinars I often look across USD-pairs in effort of deducing which pairs are most attractive for strength or weakness in DXY. And as I’ve been saying for much of Q3 and into Q4, and then again this Tuesday, USD/CAD retains attraction for USD-strength scenarios.
This isn’t to say that support in USD/CAD cannot give way, but if it does, I question whether USD/CAD is the most attractive currency pair to work with that weakness, when a backdrop like EUR/USD or GBP/USD has shown healthier construction to counter a weak USD. USD/CAD, however, stands out if we see USD-strength come back, particularly if that 98.98 Fibonacci level in DXY plays as a higher-low support. The fact that USD/CAD has hovered around the same support for a fourth day highlights the deduction of Canadian Dollar weakness.
As an example of that 1.4000 level holding over a multi-day period, we only need to draw back to the month of May, when the bounce from 1.3750 was taking hold. The 1.4000 level traded for three out of four days, before a lower-high printed and then, ultimately, sellers took control and drove down to a fresh low.
Imagine the intra-day price action of that series, when price was poking above the 1.4000 level at which point sellers showed up – and that can be from both longs that had ridden the bounce and were now closing positions or opportunistic shorts looking to take advantage of a 'psychologically expensive’ price.
Again – there was no assurance that 1.4000 would hold as resistance forever, but the fact that it had at that point meant that traders could institute an if-then statement for both USD and USD/CAD. If USD-strength comes back, the support level of 1.4000 could present a compelling spot for a higher-low, which would open the door to a re-test of 1.4068 after which the prior high of 1.4041 would come into view.
On the underside of price – the big level is the 1.3900 area where price had turned two weeks ago, helped along by the BoC and FOMC rate decisions. If sellers take that out, it will look as though they have firm control of short-term trends but at that point I question whether there will still be a more attractive backdrop for Dollar weakness elsewhere, such as against the Euro or British Pound.
USD/CAD Daily Chart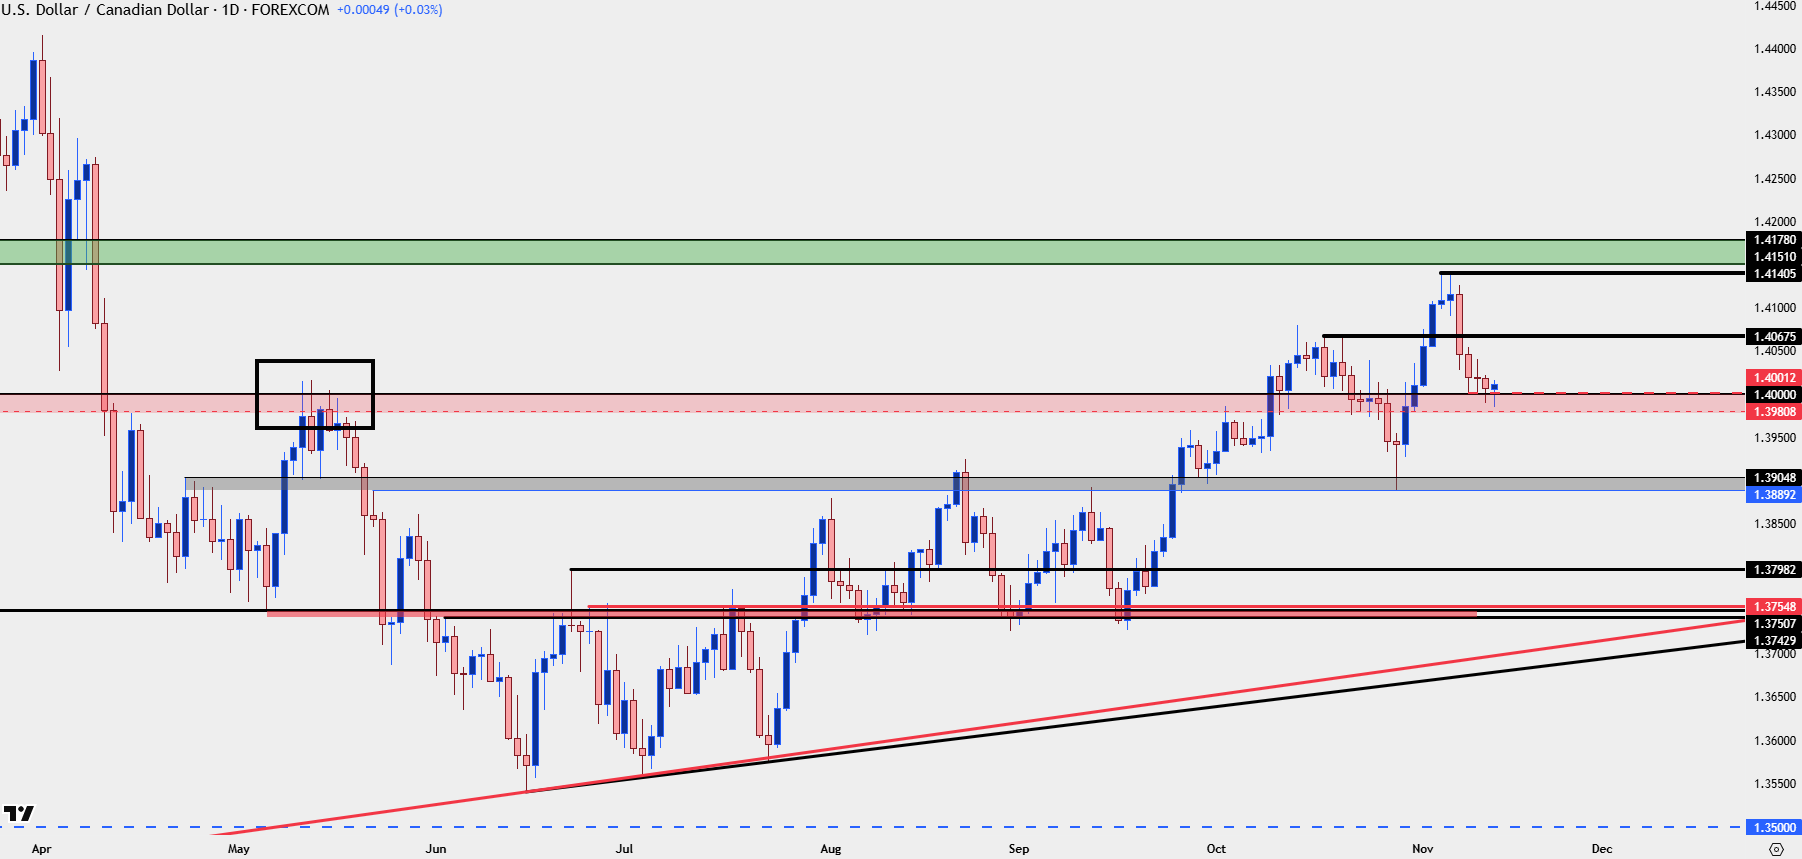
Chart prepared by James Stanley; data derived from Tradingview
--- written by James Stanley, Senior Market Analyst, Global Macro
Related tags:


Open an account in minutes
Experience award-winning platforms with fast and secure execution, and enjoy tight spreads from 0.5 pts on FX and 0.3 pts on indices.
Economic calendar
Web Trader platform
Our sophisticated web-based platform is packed with features.
Related articles

USD/CAD forecast: rally could accelerate above June highs at 1.4250
USD/CAD recovered quickly after weaker US jobs data, keeping the bullish trend in focus. A move above the June highs could accelerate the rally as inflation keeps the Fed under pressure.


USD Sets Fresh Yearly High as EUR/USD Drops Dramatically, USD/JPY Stable
Well, it was a week of USD strength that wasn’t entirely pushed by USD/JPY, as a strong sell-off in EUR/USD has pushed the major pair to its most oversold state in a decade.

What Stretched 10-Year Yields Mean for Major Currency Pairs in Q4
U.S. 10-year Treasury yields are nearing a long-term resistance zone with overbought RSI readings, raising near-term pullback risk for the dollar.

This report is intended for general circulation only. It should not be construed as a recommendation, or an offer (or solicitation of an offer) to buy or sell any financial products. The information provided does not take into account your specific investment objectives, financial situation or particular needs. Before you act on any recommendation that may be contained in this report, independent advice ought to be sought from a financial adviser regarding the suitability of the investment product, taking into account your specific investment objectives, financial situation or particular needs.
StoneX Financial Pte. Ltd., may distribute reports produced by its respective foreign entities or affiliates within the StoneX group of companies or third parties pursuant to an arrangement under Regulation 32C of the Financial Advisers Regulations. Where the report is distributed to a person in Singapore who is not an accredited investor, expert investor or an institutional investor (as defined in the Securities Futures Act), StoneX Financial Pte. Ltd. accepts legal responsibility to such persons for the contents of the report only to the extent required by law. Singapore recipients should contact StoneX Financial Pte. Ltd. at 6826 9988 for matters arising from, or in connection with the report.
In the case of all other recipients of this report, to the extent permitted by applicable laws and regulations neither StoneX Financial Pte. Ltd. nor its associated companies will be responsible or liable for any loss or damage incurred arising out of, or in connection with, any use of the information contained in this report and all such liability is hereby expressly disclaimed. No representation or warranty is made, express or implied, that the content of this report is complete or accurate.
StoneX Financial Pte. Ltd. is not under any obligation to update this report.
Trading CFDs carries a high level of risk that may not be suitable for some investors. Consider your investment objectives, level of experience, financial resources, risk appetite and other relevant circumstances carefully. The possibility exists that you could lose some or all of your investments, including your initial deposits. If in doubt, please seek independent expert advice. Visit www.forex.com/en-sg/terms-and-policies for the complete Risk Disclosure Statement.