



Crude Oil Weekly Outlook: Hormuz News Is Noise, Price Action Leads
Crude Oil Weekly Outlook: Hormuz headlines remain noise, while price action stays in focus as traders navigate sharp volatility swings driven by shifting developments between the US, Iran, and Lebanon. The $76–75 zone remains a critical support level.
Share this:

Headline-driven volatility continues to dominate short-term price swings, but key technical levels remain intact. The $76–74 zone has repeatedly held as support following declines from the $100 level, marking a significant level tied to the previous Middle East escalation in 2025 between the US, Iran, and Israel.
Disruptions around the Strait of Hormuz typically take time to fully unwind across global energy and commodity supply chains, keeping short-term inflation risks and geopolitical premiums elevated.
Frequent shifts in headlines—ranging from the Strait reopening, partial access for commercial shipping, renewed closures, or US naval blockades—should be viewed primarily as short-term volatility drivers, rather than structural trend changes. These developments sit within the broader framework outlined in the Crude Oil Q2 2026 outlook, which defines the bullish, neutral, and bearish zones.
Confirming longer-term reversals requires alignment with shorter timeframes and pattern confirmation, as illustrated in the 2-week and daily WTI charts below.
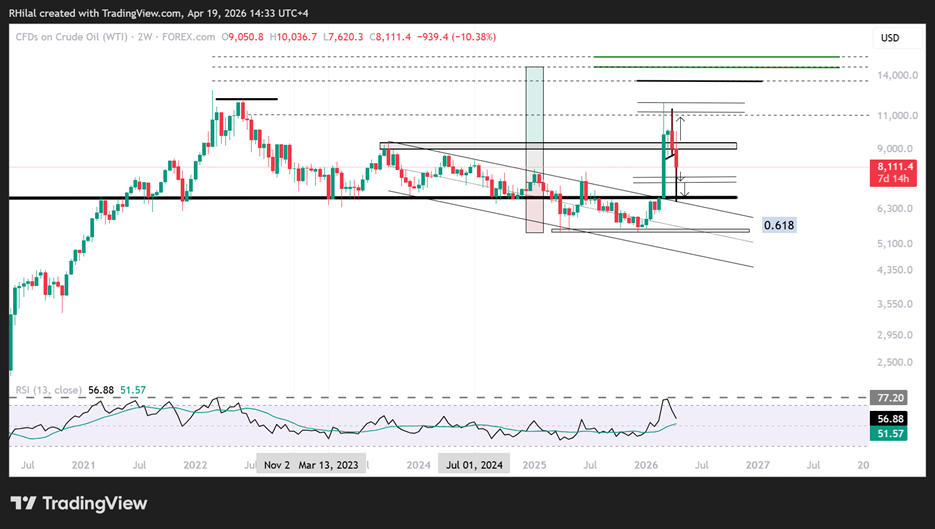
Crude Oil Weekly Outlook: 2 Week Time Frame – Log Scale
Source: Trading view
The latest decline in crude oil has broken below the previously outlined bullish scenario on the 2-week timeframe, shifting the outlook into a transitional zone between bullish continuation and potential bearish consolidation.
Bearish Scenario
With prices now trading near the lower end of the $80 range, key support levels lie at $76 and $74, aligning with highs from last year’s Middle East conflict. A confirmed breakdown below these levels could expose $67, signaling a broader, longer-term consolidation phase.
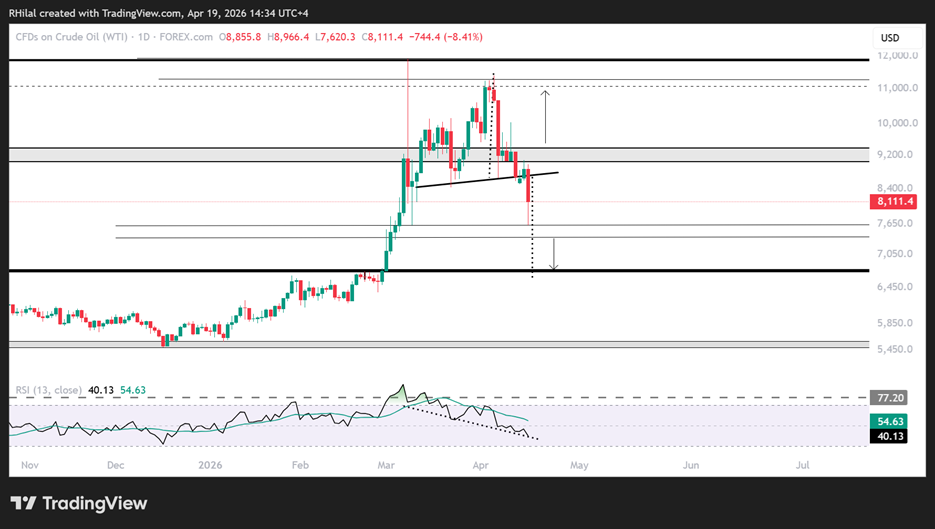
Crude Oil Weekly Outlook: Daily Time Frame – Log Scale
Source: Trading view
The recent reversal was further confirmed by a head and shoulders breakout pattern on the daily timeframe, reinforcing the importance of technical analysis in navigating headline-driven markets. A break below the neckline at $84 triggered a sharp decline toward the $76 zone.
The full measured move of this pattern points toward the $67 level, a historically significant support and resistance zone for crude since 2018. This scenario would require a confirmed breakdown below the $76–75 support zone.
On the upside, if crude manages to recover above the $88–93 zone—aligned with 2023 highs—bullish momentum could re-emerge. This would bring the $115 level back into focus, with potential extension toward the $130–150 range.
Conclusion: Focus on Structure, Not Headlines
Despite ongoing geopolitical developments, price action remains the most reliable guide. While Hormuz-related headlines will continue to drive short-term volatility, sustained trends will be confirmed only through key technical levels and pattern validation.
Written by Razan Hilal, CMT
Follow on X: @Rh_waves




Open an account in minutes
Experience award-winning platforms with fast and secure execution, and enjoy tight spreads from 0.5 pts on FX and 0.3 pts on indices.
Economic calendar
Web Trader platform
Our sophisticated web-based platform is packed with features.
Related articles

Dow Jones Forecast: DJIA rises after weaker jobs data
U.S. stocks are rising after weaker-than-expected U.S. jobs data saw markets rein in rate hike expectations.


Gold Price Forecast: XAU/USD Plunges 12.4% Toward Critical Support 10 1 2026
Softer inflation has revived expectations for a Fed pause, but Friday’s payrolls could put gold’s recovery prospects to the test.


Nasdaq 100 Forecast: NDX slips as Treasury yields keep rising
U.S. stocks are falling at the start of Q4, as gains in software stocks offset concerns over soaring Treasury yields. U.S. Treasury yields continue to rise, with the 10-year yield up 2 basis points at 5.31% and the 30-year at 5.66%, multi-decade highs.
This report is intended for general circulation only. It should not be construed as a recommendation, or an offer (or solicitation of an offer) to buy or sell any financial products. The information provided does not take into account your specific investment objectives, financial situation or particular needs. Before you act on any recommendation that may be contained in this report, independent advice ought to be sought from a financial adviser regarding the suitability of the investment product, taking into account your specific investment objectives, financial situation or particular needs.
StoneX Financial Pte. Ltd., may distribute reports produced by its respective foreign entities or affiliates within the StoneX group of companies or third parties pursuant to an arrangement under Regulation 32C of the Financial Advisers Regulations. Where the report is distributed to a person in Singapore who is not an accredited investor, expert investor or an institutional investor (as defined in the Securities Futures Act), StoneX Financial Pte. Ltd. accepts legal responsibility to such persons for the contents of the report only to the extent required by law. Singapore recipients should contact StoneX Financial Pte. Ltd. at 6826 9988 for matters arising from, or in connection with the report.
In the case of all other recipients of this report, to the extent permitted by applicable laws and regulations neither StoneX Financial Pte. Ltd. nor its associated companies will be responsible or liable for any loss or damage incurred arising out of, or in connection with, any use of the information contained in this report and all such liability is hereby expressly disclaimed. No representation or warranty is made, express or implied, that the content of this report is complete or accurate.
StoneX Financial Pte. Ltd. is not under any obligation to update this report.
Trading CFDs carries a high level of risk that may not be suitable for some investors. Consider your investment objectives, level of experience, financial resources, risk appetite and other relevant circumstances carefully. The possibility exists that you could lose some or all of your investments, including your initial deposits. If in doubt, please seek independent expert advice. Visit www.forex.com/en-sg/terms-and-policies for the complete Risk Disclosure Statement.