






Daily Forex Technical Trend Bias Key Levels Fri 28 Jun ahead of G20
Ahead of G20, GBP/USD remains below resistance while bulls in USD/JPY and AUD/USD are showing signs of exhuastion.
Share this:

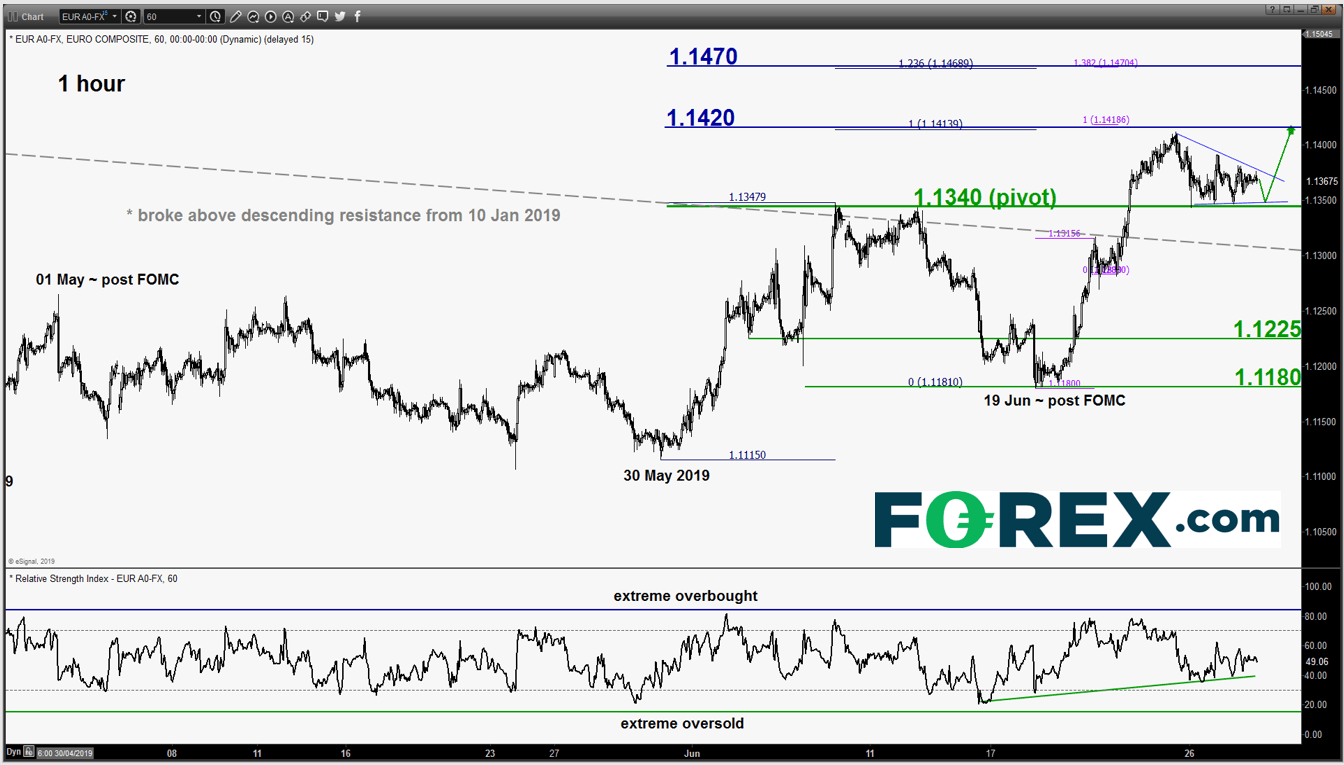
EUR/USD – Tight consolidation above 1.1340 key support
click to enlarge chart
- Continued to trade sideways after a test on the 1.1340 key short-term pivotal support. It has now started to evolve within a minor “pennant” contracting range configuration, maintain bullish bias for a potential push up to target the next intermediate resistance at 1.1420.
- On the other hand, a break with an hourly close below 1.1340 invalidates the bullish scenario for a slide back towards the 1.1225/1180 support zone in the first step.
GBP/USD – Bears remains in control
click to enlarge chart
- Staged the expected bearish breakdown from the micro “pennant” range configuration in place since 26 Jun 2019 low as per highlighted in our previous report (click here for a recap). Maintain bearish bias with a tightened key short-term pivotal resistance at 1.2730 for a further potential push down to retest the major support zone of 1.2560/2500 (also the ascending trendline from Oct 2016 swing low).
- On the other hand, a break above 1.2730 negates the bearish tone for a retest on the recent range resistance of 1.2785. Only an hourly close above 1.2785 validates a corrective rebound scenario towards the next resistance at 1.2915 (also the descending trendline from 13 Mar 2019 high).
USD/JPY – Potential residual push up before medium-term down move resumes
click to enlarge chart
- Inched higher as expected and almost hit the upside/target of 108.20 as per highlighted in our previous report (printed a high of 108.16 in yesterday’s early European session.
- Elliot Wave/fractal analysis suggest that the minor corrective rebound in place since 106.75 low of 25 Jun 2019 may have a residual upleg left before the medium-term down move sequence resumes. Maintain bullish bias above 107.25 key short-term pivotal support for a residual potential push up to target 108.20 with a maximum limit set at the 108.70 key medium-term resistance.
- On the other hand, an hourly close below 107.25 revives the bears for a downleg towards the next support at 106.60/50.
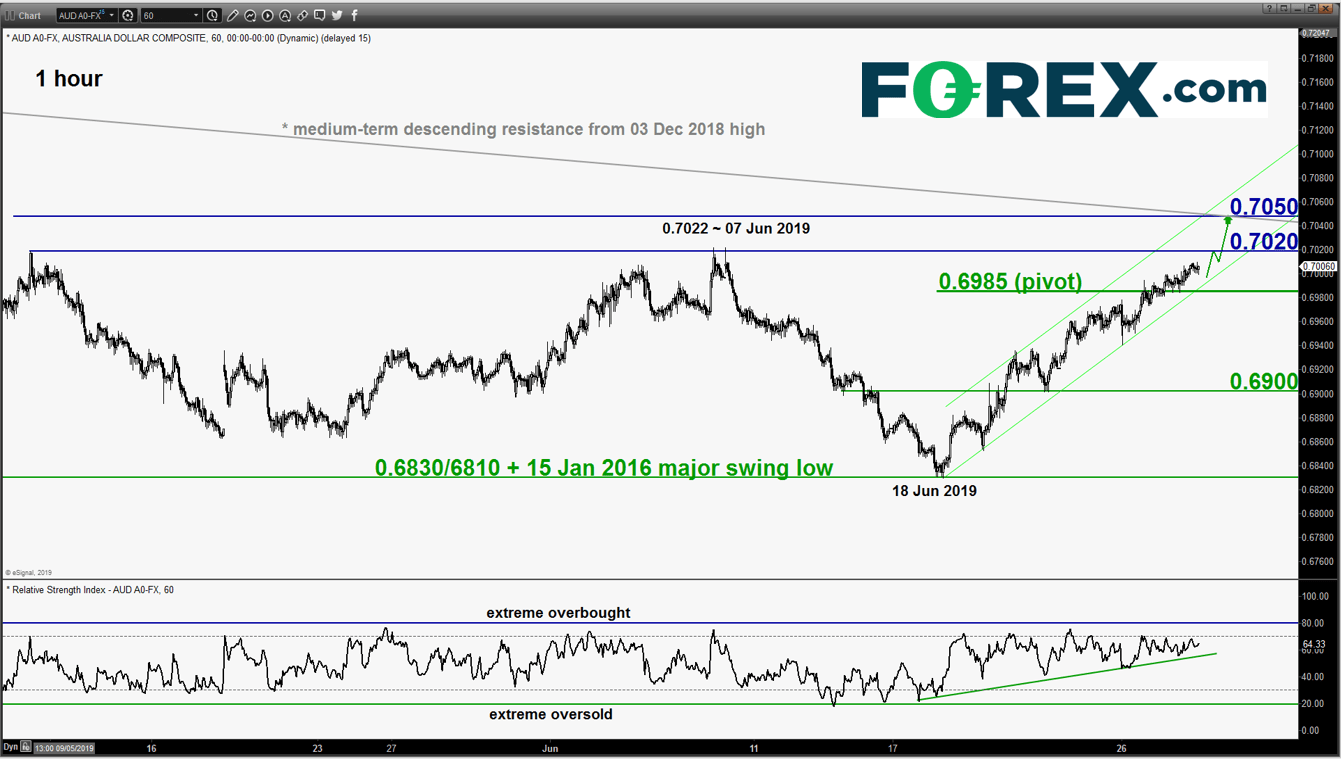
AUD/USD – Potential residual push up to end corrective rebound
click to enlarge chart
- Continued its slow grind upwards as expected as per highlighted in our previous report. Maintain bullish bias with an adjusted key short-term pivotal support now at 0.6985 for a potential residual push up to target 0.7020 follow by the key medium-term resistance at 0.7050 (also a Fibonacci expansion/retracement cluster & the minor ascending channel resistance from 18 Jun 2019).
- On the other hand, an hourly close below 0.6985 triggers the start of an impulsive downleg sequence to target the next near-term support at 0.6900 in the first step.
Charts are from eSignal
EUR/USD – Tight consolidation above 1.1340 key support
click to enlarge chart
- Continued to trade sideways after a test on the 1.1340 key short-term pivotal support. It has now started to evolve within a minor “pennant” contracting range configuration, maintain bullish bias for a potential push up to target the next intermediate resistance at 1.1420.
- On the other hand, a break with an hourly close below 1.1340 invalidates the bullish scenario for a slide back towards the 1.1225/1180 support zone in the first step.
GBP/USD – Bears remains in control
click to enlarge chart
- Staged the expected bearish breakdown from the micro “pennant” range configuration in place since 26 Jun 2019 low as per highlighted in our previous report (click here for a recap). Maintain bearish bias with a tightened key short-term pivotal resistance at 1.2730 for a further potential push down to retest the major support zone of 1.2560/2500 (also the ascending trendline from Oct 2016 swing low).
- On the other hand, a break above 1.2730 negates the bearish tone for a retest on the recent range resistance of 1.2785. Only an hourly close above 1.2785 validates a corrective rebound scenario towards the next resistance at 1.2915 (also the descending trendline from 13 Mar 2019 high).
USD/JPY – Potential residual push up before medium-term down move resumes
click to enlarge chart
- Inched higher as expected and almost hit the upside/target of 108.20 as per highlighted in our previous report (printed a high of 108.16 in yesterday’s early European session.
- Elliot Wave/fractal analysis suggest that the minor corrective rebound in place since 106.75 low of 25 Jun 2019 may have a residual upleg left before the medium-term down move sequence resumes. Maintain bullish bias above 107.25 key short-term pivotal support for a residual potential push up to target 108.20 with a maximum limit set at the 108.70 key medium-term resistance.
- On the other hand, an hourly close below 107.25 revives the bears for a downleg towards the next support at 106.60/50.
AUD/USD – Potential residual push up to end corrective rebound
click to enlarge chart
- Continued its slow grind upwards as expected as per highlighted in our previous report. Maintain bullish bias with an adjusted key short-term pivotal support now at 0.6985 for a potential residual push up to target 0.7020 follow by the key medium-term resistance at 0.7050 (also a Fibonacci expansion/retracement cluster & the minor ascending channel resistance from 18 Jun 2019).
- On the other hand, an hourly close below 0.6985 triggers the start of an impulsive downleg sequence to target the next near-term support at 0.6900 in the first step.
Charts are from eSignal


Open an account in minutes
Experience award-winning platforms with fast and secure execution, and enjoy tight spreads from 0.5 pts on FX and 0.3 pts on indices.
Economic calendar
Web Trader platform
Our sophisticated web-based platform is packed with features.
Related articles
USD/CAD shooting star puts September surge on notice
USD/CAD has printed a clear bearish reversal pattern after an extraordinary September surge, but confirmation may depend heavily on how US Treasury yields react to Friday’s payrolls report.

USD/CHF Reverses as Swiss Franc Surges amid Bond Carnage
USD/CHF reverses from channel resistance as bond volatility surges and broad Swiss franc strength points to a possible carry-trade unwind.


USD/MXN Analysis: Is Super Peso Starting to Fade?
Over recent trading sessions, the Mexican peso has continued to show signs of weakness against the U.S. dollar. This can already be seen in USD/MXN, which has gained more than 1.7% over the last three sessions, highlighting sustained buying pressure in favor of the dollar in the short term.

This report is intended for general circulation only. It should not be construed as a recommendation, or an offer (or solicitation of an offer) to buy or sell any financial products. The information provided does not take into account your specific investment objectives, financial situation or particular needs. Before you act on any recommendation that may be contained in this report, independent advice ought to be sought from a financial adviser regarding the suitability of the investment product, taking into account your specific investment objectives, financial situation or particular needs.
StoneX Financial Pte. Ltd., may distribute reports produced by its respective foreign entities or affiliates within the StoneX group of companies or third parties pursuant to an arrangement under Regulation 32C of the Financial Advisers Regulations. Where the report is distributed to a person in Singapore who is not an accredited investor, expert investor or an institutional investor (as defined in the Securities Futures Act), StoneX Financial Pte. Ltd. accepts legal responsibility to such persons for the contents of the report only to the extent required by law. Singapore recipients should contact StoneX Financial Pte. Ltd. at 6826 9988 for matters arising from, or in connection with the report.
In the case of all other recipients of this report, to the extent permitted by applicable laws and regulations neither StoneX Financial Pte. Ltd. nor its associated companies will be responsible or liable for any loss or damage incurred arising out of, or in connection with, any use of the information contained in this report and all such liability is hereby expressly disclaimed. No representation or warranty is made, express or implied, that the content of this report is complete or accurate.
StoneX Financial Pte. Ltd. is not under any obligation to update this report.
Trading CFDs carries a high level of risk that may not be suitable for some investors. Consider your investment objectives, level of experience, financial resources, risk appetite and other relevant circumstances carefully. The possibility exists that you could lose some or all of your investments, including your initial deposits. If in doubt, please seek independent expert advice. Visit www.forex.com/en-sg/terms-and-policies for the complete Risk Disclosure Statement.