



Dow Jones Analysis: DJIA faces renewed bearish bias amid rising tensions
It has been a difficult session for the Dow Jones index, as price action shows a decline of more than 1.00%, marking a new short-term bearish bias. The selling pressure emerging in the index is driven by weakening confidence in risk assets following renewed tensions between Iran and the United States.
Share this:

It has been a difficult session for the Dow Jones index, as price action shows a decline of more than 1.00%, marking a new short-term bearish bias. The selling pressure emerging in the index is driven by weakening confidence in risk assets following renewed tensions between Iran and the United States, as well as the persistence of elevated interest rates from the Federal Reserve. Both factors have prevented stable demand from forming, which could lead to more sustained selling pressure in the coming sessions.


Are peace talks failing?
Nearly one month into the Middle East conflict, there have been attempts by the United States to promote a ceasefire aimed at stabilizing the region and reducing global risk perception. However, during today’s session, Iran rejected the proposal, stating it would not negotiate under pressure and that any agreement must be made under its own terms.
This highlights the lack of progress in negotiations and the absence of clear signs of de-escalation in the short term.
This situation has led to a renewed increase in oil prices, with WTI crude approaching the $95 level. It has also negatively impacted market confidence, as reflected in the Fear and Greed Index, which has dropped to around 18 points, remaining firmly in “extreme fear” territory.

Source: CNN
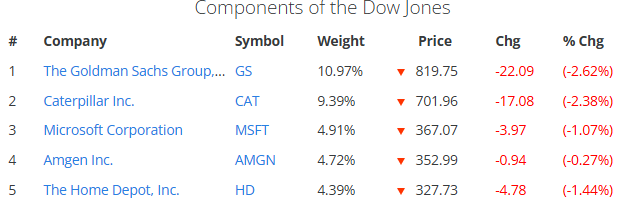
This deterioration in sentiment is also visible in the performance of the main Dow Jones components. In today’s session, the top five stocks are all in negative territory: Goldman Sachs (-2.62%), Caterpillar (-2.38%), Microsoft (-1.07%), Amgen (-0.27%), and Home Depot (-1.44%), highlighting broad-based weakness across the equity market.
Source: Slickcharts
In this environment, rising risk perception has weakened appetite for equities, reducing demand for U.S. stocks. Capital may be rotating toward safer assets, and as long as the conflict persists without resolution, this dynamic could continue to weigh on confidence and reinforce downside pressure on the Dow Jones.
The central bank remains strict
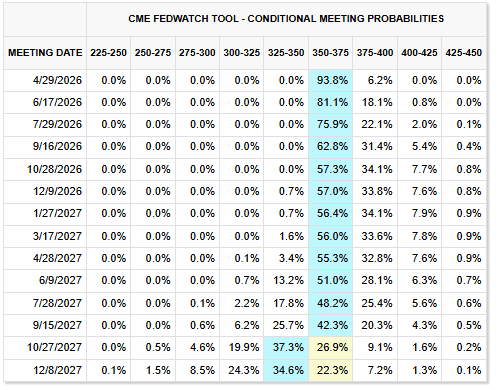
Another key factor is the stance of the Federal Reserve following its latest policy decision. The current outlook reinforces a no-change scenario, with a high probability that rates will remain at 3.75% at least through September 2027, according to the CME Group.
Additionally, starting from July 2026, there is a growing probability that rates could increase toward 4.00%, reflecting a shift toward a more restrictive stance, partly driven by inflation risks linked to the Middle East conflict.
Source: CMEGROUP
This environment is negative for equities, as higher rates for longer tend to pressure consumption and corporate margins. It has also pushed up U.S. 10-year Treasury yields, which are now near 4.4%, levels not seen since July 2025.
This increases the attractiveness of fixed income and may reduce demand for equities. In this context, restrictive monetary policy could continue to weigh on the Dow Jones in the short term.
Dow Jones Technical Outlook
Source: StoneX, Tradingview
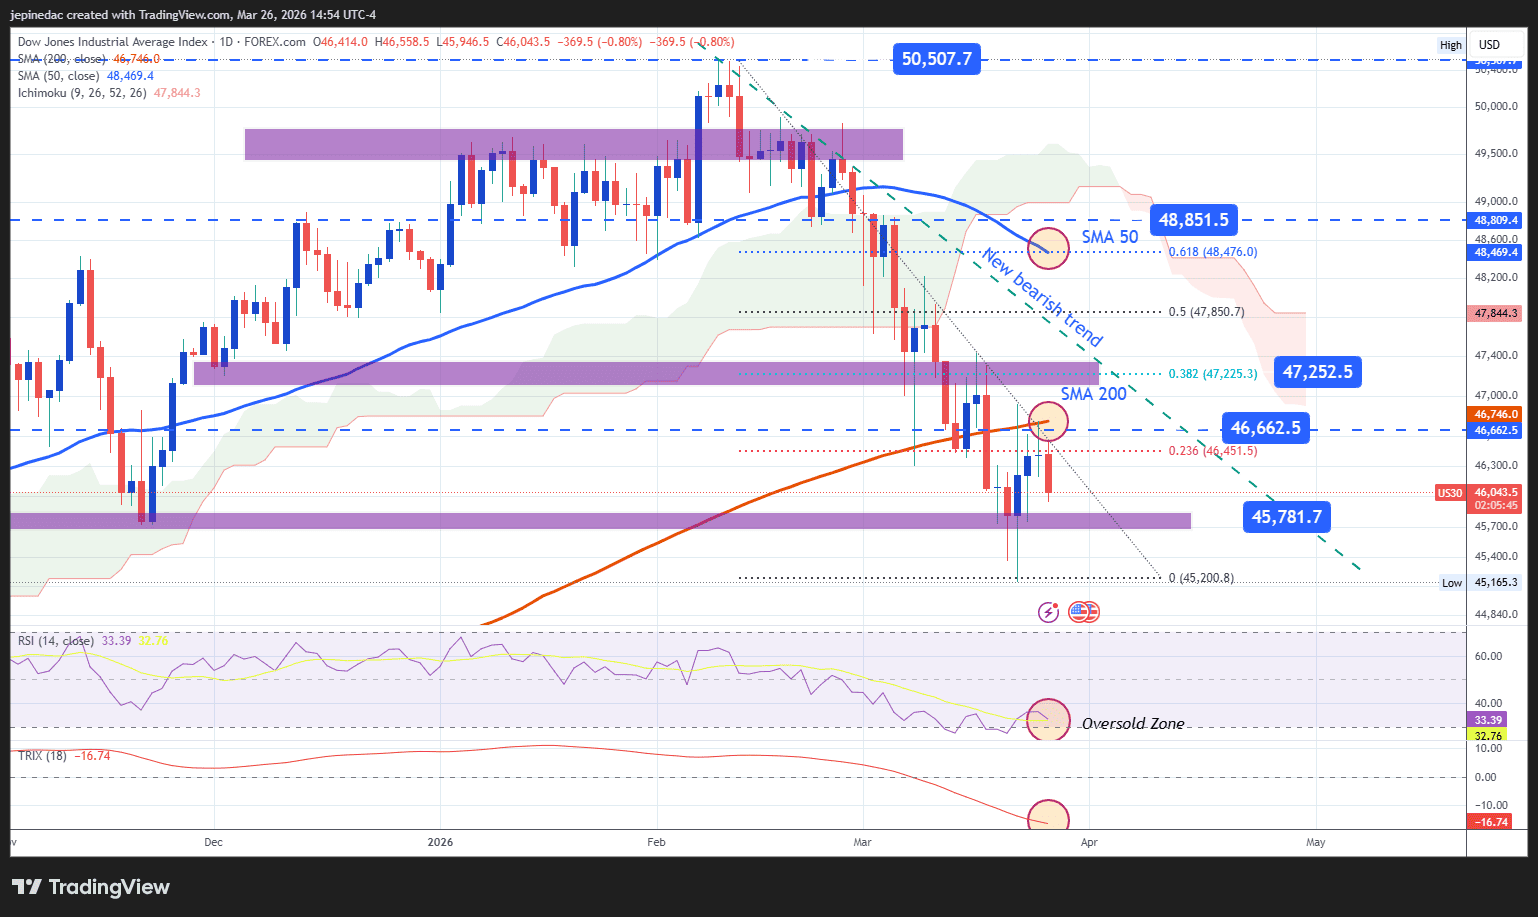
- Bearish trend gains traction: Recent price action in the Dow Jones has begun to form a downward trendline, which is becoming one of the most relevant structures on the chart. If selling pressure persists, this structure could strengthen and dominate price movements in the coming weeks. However, as price approaches key levels, there is still room for short-term corrective rebounds.
- RSI: The RSI remains below the 50 level, confirming the dominance of selling pressure over the past 14 sessions. However, it is approaching the oversold zone (30), which could signal potential technical rebounds as recent selling pressure becomes excessive.
- TRIX: The TRIX indicator continues to trade below the zero line, suggesting that long-term exponential moving average momentum remains bearish, and this bias could persist in price action over the coming weeks.
Key levels:
- 47,252 points – Key resistance: A zone of recent highs aligned with the newly formed downward trendline and the 38.2% Fibonacci retracement level. A move above this area could break the current bearish structure and trigger a more consistent bullish bias.
- 46,662 points – Near-term barrier: A neutrality zone aligned with the 200-period moving average. Price action around this level could reinforce short-term indecision and lead to the formation of a more consistent sideways range.
- 45,780 points – Key support: A level not seen since November 2025, acting as the main downside barrier. A break below this area could reinforce the current bearish bias and extend the downtrend as the dominant pattern in the short term.
Written by Julian Pineda, CFA, CMT – Market Analyst
Follow him on: @julianpineda25
Latest market news




Open an account in minutes
Experience award-winning platforms with fast and secure execution, and enjoy tight spreads from 0.5 pts on FX and 0.3 pts on indices.
Economic calendar
Web Trader platform
Our sophisticated web-based platform is packed with features.
Related articles
Nasdaq 100 forecast: Stocks rebound but AI concerns linger
The Nasdaq 100 was finding some support at 28,000 after recent sell-off amid concerns about the AI trade. Even with oscillators oversold, the risk to the near-term forecast is tilted to the downside.


FX, Commodities, and Indices: Major Moves and Key Levels
The U.S. Dollar Index, commodities, indices and cryptocurrencies are testing key levels as markets navigate the U.S. midterm elections, U.S.–Iran negotiations and key economic releases.


Have Markets Found a Turning Point Ahead of the Elections?
Fed rate-hike bets topping 70% have pressured markets, including precious metals and U.S. indices, toward key support levels. Could these levels signal a turning point ahead of the U.S. midterm elections?
This report is intended for general circulation only. It should not be construed as a recommendation, or an offer (or solicitation of an offer) to buy or sell any financial products. The information provided does not take into account your specific investment objectives, financial situation or particular needs. Before you act on any recommendation that may be contained in this report, independent advice ought to be sought from a financial adviser regarding the suitability of the investment product, taking into account your specific investment objectives, financial situation or particular needs.
StoneX Financial Pte. Ltd., may distribute reports produced by its respective foreign entities or affiliates within the StoneX group of companies or third parties pursuant to an arrangement under Regulation 32C of the Financial Advisers Regulations. Where the report is distributed to a person in Singapore who is not an accredited investor, expert investor or an institutional investor (as defined in the Securities Futures Act), StoneX Financial Pte. Ltd. accepts legal responsibility to such persons for the contents of the report only to the extent required by law. Singapore recipients should contact StoneX Financial Pte. Ltd. at 6826 9988 for matters arising from, or in connection with the report.
In the case of all other recipients of this report, to the extent permitted by applicable laws and regulations neither StoneX Financial Pte. Ltd. nor its associated companies will be responsible or liable for any loss or damage incurred arising out of, or in connection with, any use of the information contained in this report and all such liability is hereby expressly disclaimed. No representation or warranty is made, express or implied, that the content of this report is complete or accurate.
StoneX Financial Pte. Ltd. is not under any obligation to update this report.
Trading CFDs carries a high level of risk that may not be suitable for some investors. Consider your investment objectives, level of experience, financial resources, risk appetite and other relevant circumstances carefully. The possibility exists that you could lose some or all of your investments, including your initial deposits. If in doubt, please seek independent expert advice. Visit www.forex.com/en-sg/terms-and-policies for the complete Risk Disclosure Statement.