



Dow Jones Forecast: Key Levels in Focus
Dow Jones Forecast: Following the strong rebound from the 2020 lows, the Dow Jones Industrial Average has continued to extend within a contracting diagonal structure, approaching a potential inflection point ahead of a notable retracement. This setup aligns with rising haven demand and increasing geopolitical frictions. The 50,000 level remains pivotal for trend continuation into Q1 2026.
Share this:
Key Events
- Geopolitical tensions have given 2026 an early and cautious start, limiting rally potential across equity indices so far and keeping safe havens in focus.
- The Dow recorded a new high near 49,300 before quickly pulling back toward the 48,000 range, reflecting constrained risk appetite and the presence of key resistance levels.
- Momentum across indices has slowed relative to 2025, following an extreme year of policy shifts, price moves, and headline-driven volatility. This warrants caution for a potential corrective phase before the primary uptrend resumes.
- High volatility risk potential : US NFP report on Friday
In my previous Trades to Watch in 2026 – Dow Jones Article, I highlighted the recurring cycle equity indices often experience during a president’s second year in office. Historically, sharp policy shifts are frequently followed by consolidation phases, allowing markets to reset before resuming their primary trend.
Given Trump’s aggressive policy changes throughout 2025, including tariffs and dovish pressures from the Federal Reserve, concerns surrounding Fed independence during this year’s elections are also increasing. These risks heighten inflation concerns should rate cuts materialize faster than anticipated, contributing to a more uncertain outlook for interest rates and broader financial markets as we move into 2026.
Beyond the Dow’s contracting structure, the Nasdaq is displaying a notable divergence relative to both the Dow and the S&P 500. The index has failed to record new highs since October 2025, raising questions around AI and technology valuations, as well as the sustainability of investment appetite in the sector amid an increasingly uncertain geopolitical backdrop heading into 2026.
Dow Jones Forecast: Monthly Time Frame – Log Scale
Source: Trading view
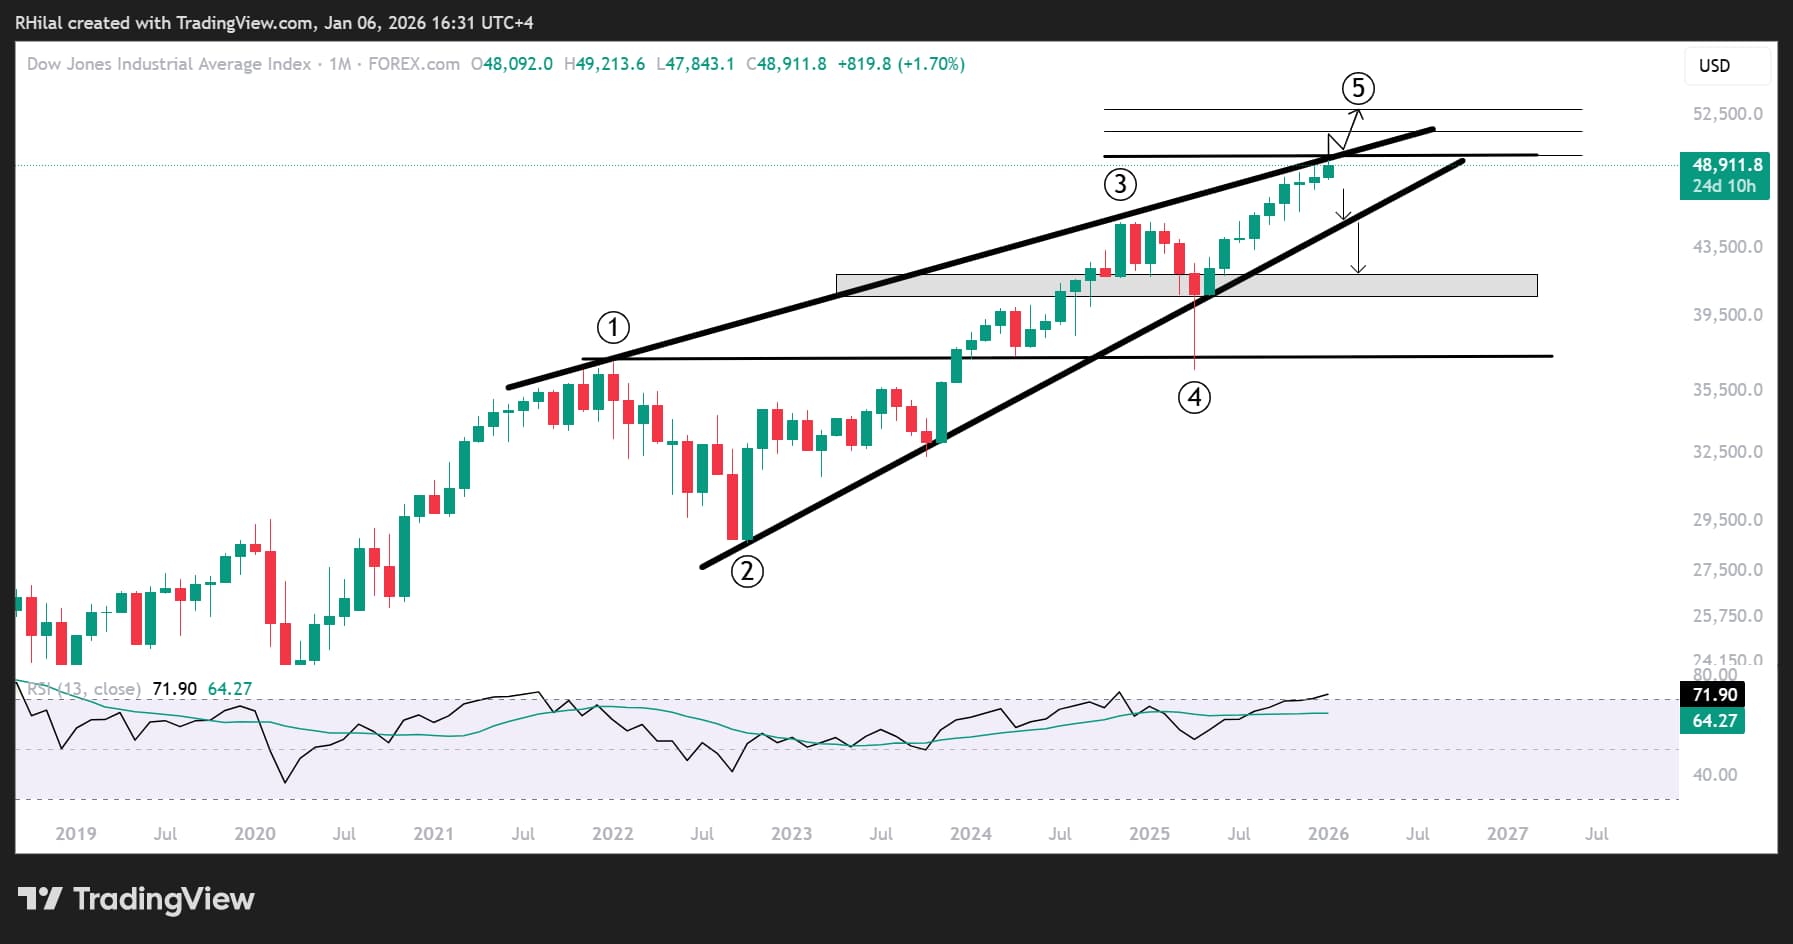
Zooming out to the monthly time frame, a clear contracting price structure emerges, connecting consecutive higher highs from January 2022, November 2024, and December 2025. This diagonal-like formation increases the risk of sharper price scenarios as the Dow approaches the 50,000-threshold.
Should a clean breakout above the 50,000 level occur, price extensions toward 51,300 and 53,000 become likely. These targets are derived using the Fibonacci extension tool, measured from the September 2022 low to the November 2024 high, and projected from the April 2025 low.
On the downside, in line with overbought monthly RSI conditions and a trendline connecting higher highs between 2022 and 2025, a sustained move below 48,000 could extend corrective projections toward 45,000 and potentially 40,500. Such a scenario would likely coincide with a broader market pullback or corrective phase before the longer-term uptrend resumes.
Written by Razan Hilal, CMT
Follow on X: @RH_waves
Related tags:
Latest market news




Open an account in minutes
Experience award-winning platforms with fast and secure execution, and enjoy tight spreads from 0.5 pts on FX and 0.3 pts on indices.
Economic calendar
Web Trader platform
Our sophisticated web-based platform is packed with features.
Related articles
Gold outlook: XAU/USD hammered, stretched and vulnerable to a sharp rebound
Gold is getting hammered for solid fundamental reasons, but history suggests extreme four-hourly oversold conditions can produce violent countertrend rallies.
EUR/USD, USD/JPY Outlook: Oil, yields and an FX identity crisis
Crude oil is setting the tone across rates and FX, leaving EUR/USD vulnerable and USD/JPY caught between higher Treasury yields and the growing threat of intervention

Gold Dips Below Three-Month Uptrend, Bitcoin Pulls Back from Nine-Month High
Gold has dipped below its three-month uptrend, while Bitcoin has pulled back from a nine-month high as U.S. bond yields test levels last seen in 2004 and 2007. Risks build as Fed rate-hike expectations remain above 70%, while the Dollar Index holds near yearly highs.
This report is intended for general circulation only. It should not be construed as a recommendation, or an offer (or solicitation of an offer) to buy or sell any financial products. The information provided does not take into account your specific investment objectives, financial situation or particular needs. Before you act on any recommendation that may be contained in this report, independent advice ought to be sought from a financial adviser regarding the suitability of the investment product, taking into account your specific investment objectives, financial situation or particular needs.
StoneX Financial Pte. Ltd., may distribute reports produced by its respective foreign entities or affiliates within the StoneX group of companies or third parties pursuant to an arrangement under Regulation 32C of the Financial Advisers Regulations. Where the report is distributed to a person in Singapore who is not an accredited investor, expert investor or an institutional investor (as defined in the Securities Futures Act), StoneX Financial Pte. Ltd. accepts legal responsibility to such persons for the contents of the report only to the extent required by law. Singapore recipients should contact StoneX Financial Pte. Ltd. at 6826 9988 for matters arising from, or in connection with the report.
In the case of all other recipients of this report, to the extent permitted by applicable laws and regulations neither StoneX Financial Pte. Ltd. nor its associated companies will be responsible or liable for any loss or damage incurred arising out of, or in connection with, any use of the information contained in this report and all such liability is hereby expressly disclaimed. No representation or warranty is made, express or implied, that the content of this report is complete or accurate.
StoneX Financial Pte. Ltd. is not under any obligation to update this report.
Trading CFDs carries a high level of risk that may not be suitable for some investors. Consider your investment objectives, level of experience, financial resources, risk appetite and other relevant circumstances carefully. The possibility exists that you could lose some or all of your investments, including your initial deposits. If in doubt, please seek independent expert advice. Visit www.forex.com/en-sg/terms-and-policies for the complete Risk Disclosure Statement.