



EUR/USD Analysis: The euro attempts to recover the 1.16000 level
Over the past five trading sessions, the EUR/USD pair has begun to show a steady upward movement, reflected in a recovery of more than 0.7%. For now, the buying pressure supporting the euro comes partly from the recent weakness in the U.S. dollar, along with a neutral stance from the European Central Bank (ECB)—factors that have allowed the European currency to regain ground consistently.
Share this:

Over the past five trading sessions, the EUR/USD pair has begun to show a steady upward movement, reflected in a recovery of more than 0.7%. For now, the buying pressure supporting the euro comes partly from the recent weakness in the U.S. dollar, along with a neutral stance from the European Central Bank (ECB)—factors that have allowed the European currency to regain ground consistently. As long as these elements remain relevant catalysts, buying pressure may continue dominating short-term movements in EUR/USD.


The European Central Bank takes the lead
With the final month of the year approaching, markets are focused on the policy decisions that will shape the outlook for both the euro and the dollar in December. On one hand, the ECB maintains a clearer perspective regarding its year-end strategy, in contrast to the Federal Reserve, whose economic data releases were disrupted weeks ago by the U.S. government shutdown, causing delays and gaps in key indicators.
At the moment, the ECB has not signaled any meaningful changes for December and continues leaning toward maintaining interest rates stable at 2.00% in its deposit facility. This outlook is supported by the ECBWATCH probability model, which assigns a 96.7% chance of no rate changes at the upcoming December 16 meeting.

Source: ECBWATCH
In contrast, the Federal Reserve’s direction remains unclear. The central bank has faced weeks of shifting expectations and indecision, complicating market interpretation ahead of the December 11 meeting. Currently, market consensus points to a 0.25% rate cut from the existing 4.00% benchmark. What is noteworthy is that demand for fixed-income assets in the U.S. had increased in recent weeks since Treasury yields remain higher than those in the eurozone. This has made dollar-denominated investments more attractive, but if a rate cut reduces this differential, the dollar could lose appeal, encouraging a shift toward euro-denominated investments—seen as stable and with no major changes expected in the short term.
Additionally, the more flexible monetary policy anticipated from the Federal Reserve has begun to reduce structural demand for the U.S. dollar. Lower rates diminish the appeal of fixed-income assets and, consequently, the demand for dollars needed to purchase them. This is reflected in the recent behavior of the DXY index, which measures the dollar’s strength and which has now fallen below the 100-point mark, indicating a dominant weakening in dollar performance.
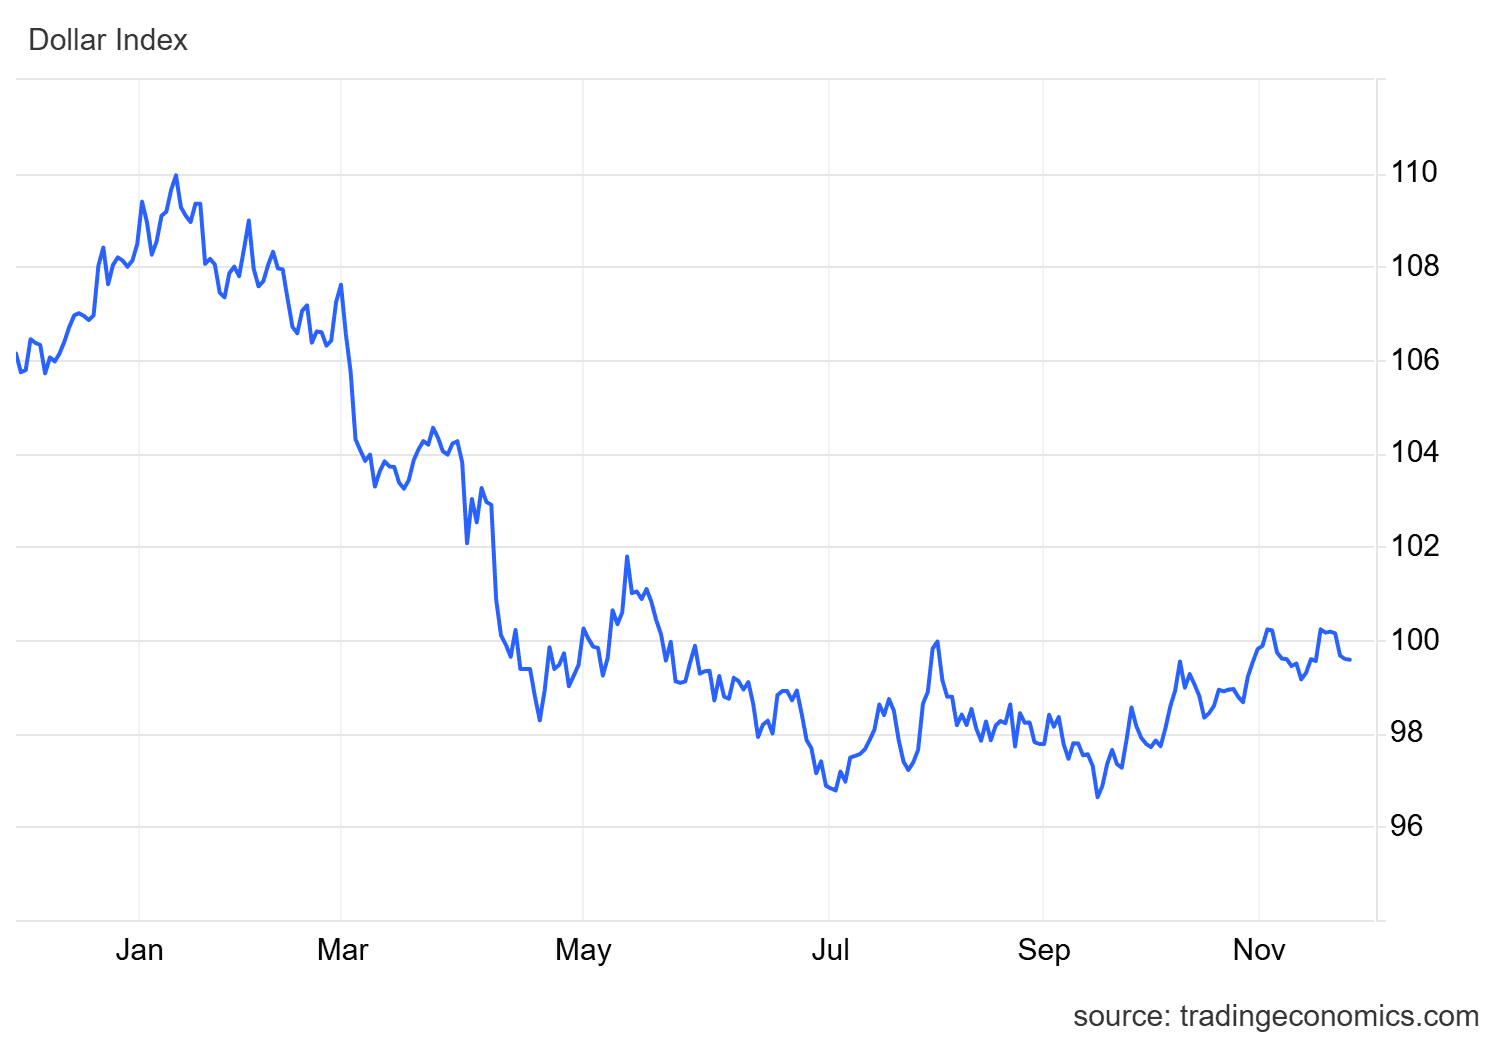
Source: TradingEconomics
Overall, it can be said that the European Central Bank has begun to take the lead. Its stable and neutral stance has provided greater confidence in euro-denominated investments, while the Federal Reserve remains in a state of uncertainty that points toward lower rates—making it more difficult for the dollar to maintain its attractiveness. If this dynamic persists, the euro may continue gaining ground, supporting consistent buying pressure on EUR/USD in the coming sessions.
EUR/USD Technical Outlook

Source: StoneX, Tradingview
- Downtrend may be at risk: Since mid-September, bearish movements have maintained a descending trendline, pushing EUR/USD to levels last seen in April. However, the recent return of buying strength is now testing this trendline, and if bullish pressure continues, the short-term bearish structure may be at risk. This could open the door to a relevant bullish bias, potentially ending the downtrend in place since September. Therefore, price action in the coming sessions will be crucial in determining whether the trendline fails, giving way to a lateral formation or even a more stable bullish structure.
- RSI: The RSI indicator continues to oscillate around the 50 level, suggesting that neutrality remains dominant in the balance between buying and selling impulses. If this pattern persists, it may lead to a period of short-term indecision.
- MACD: The MACD shows a similar scenario. Its histogram remains near the zero line, indicating a lack of dominant momentum in the short-term moving averages. This continued neutrality could also result in a steady indecision phase in price movement.
Key Levels:
- 1.16263 – Relevant resistance: This level corresponds to the barrier formed by the 50-period simple moving average. A bullish breakout above it could end the current downtrend and trigger a dominant bullish bias in the coming sessions.
- 1.15602 – Current barrier: A nearby support level aligned with a pullback zone observed since June. As long as the price remains around this level, the market may enter a lateral consolidation, offering a pause within the downtrend and potentially forming a stable sideways range.
- 1.14779 – Final support: This level represents the recent lows of the bearish trend. If selling pressure pushes price back to this area and breaks it, a more aggressive bearish bias could reactivate, restoring downward dominance in the short term.
Written by Julian Pineda, CFA, CMT – Market Analyst
Follow him at: @julianpineda25


Open an account in minutes
Experience award-winning platforms with fast and secure execution, and enjoy tight spreads from 0.5 pts on FX and 0.3 pts on indices.
Economic calendar
Web Trader platform
Our sophisticated web-based platform is packed with features.
Related articles
USD/CAD shooting star puts September surge on notice
USD/CAD has printed a clear bearish reversal pattern after an extraordinary September surge, but confirmation may depend heavily on how US Treasury yields react to Friday’s payrolls report.

USD/CHF Reverses as Swiss Franc Surges amid Bond Carnage
USD/CHF reverses from channel resistance as bond volatility surges and broad Swiss franc strength points to a possible carry-trade unwind.


USD/MXN Analysis: Is Super Peso Starting to Fade?
Over recent trading sessions, the Mexican peso has continued to show signs of weakness against the U.S. dollar. This can already be seen in USD/MXN, which has gained more than 1.7% over the last three sessions, highlighting sustained buying pressure in favor of the dollar in the short term.
This report is intended for general circulation only. It should not be construed as a recommendation, or an offer (or solicitation of an offer) to buy or sell any financial products. The information provided does not take into account your specific investment objectives, financial situation or particular needs. Before you act on any recommendation that may be contained in this report, independent advice ought to be sought from a financial adviser regarding the suitability of the investment product, taking into account your specific investment objectives, financial situation or particular needs.
StoneX Financial Pte. Ltd., may distribute reports produced by its respective foreign entities or affiliates within the StoneX group of companies or third parties pursuant to an arrangement under Regulation 32C of the Financial Advisers Regulations. Where the report is distributed to a person in Singapore who is not an accredited investor, expert investor or an institutional investor (as defined in the Securities Futures Act), StoneX Financial Pte. Ltd. accepts legal responsibility to such persons for the contents of the report only to the extent required by law. Singapore recipients should contact StoneX Financial Pte. Ltd. at 6826 9988 for matters arising from, or in connection with the report.
In the case of all other recipients of this report, to the extent permitted by applicable laws and regulations neither StoneX Financial Pte. Ltd. nor its associated companies will be responsible or liable for any loss or damage incurred arising out of, or in connection with, any use of the information contained in this report and all such liability is hereby expressly disclaimed. No representation or warranty is made, express or implied, that the content of this report is complete or accurate.
StoneX Financial Pte. Ltd. is not under any obligation to update this report.
Trading CFDs carries a high level of risk that may not be suitable for some investors. Consider your investment objectives, level of experience, financial resources, risk appetite and other relevant circumstances carefully. The possibility exists that you could lose some or all of your investments, including your initial deposits. If in doubt, please seek independent expert advice. Visit www.forex.com/en-sg/terms-and-policies for the complete Risk Disclosure Statement.