





EUR/USD Pulls Back While RSI Holds in Overbought Zone
The recent rally in EUR/USD seems to be stalling ahead of the September 2021 high (1.1909) as it falls for the first time in two weeks.
Share this:

US Dollar Forecast: EUR/USD
The recent rally in EUR/USD seems to be stalling ahead of the September 2021 high (1.1909) as it falls for the first time in two weeks, but the weakness in the exchange rate may turn out to be temporary as the Relative Strength Index (RSI) still holds in overbought territory.
EUR/USD Pulls Back While RSI Holds in Overbought Zone
EUR/USD seems to be defending the advance from the start of the week as it registers a fresh yearly high (1.1830), and the exchange rate may continue to carve a series of higher highs and lows as long as the RSI sits above 70.
US Economic Calendar
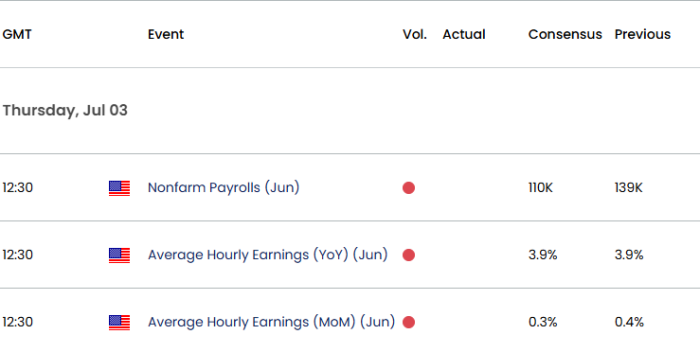
However, data prints coming out of the US may sway EUR/USD as the Non-Farm Payrolls (NFP) report is anticipated to show the economy adding 110K jobs in June following the 139K expansion the month prior, and little indications of a looming recession may keep the Federal Reserve on the sidelines as Chairman Jerome Powell tells US lawmakers that ‘we are well positioned to wait to learn more about the likely course of the economy before considering any adjustments to our policy stance.’
Join David Song for the Weekly Fundamental Market Outlook webinar. David provides a market overview and takes questions in real-time. Register Here
In turn, signs of a resilient labor market may generate a bullish reaction in the Greenback as it encourages the Federal Open Market Committee (FOMC) to retain the current policy, but a weaker-than-expected NFP print may keep EUR/USD afloat as it fuels speculation an imminent Fed rate-cut.
With said, EUR/USD may continue to track the positive slope in the 50-Day SMA (1.1404) as it still holds above the moving average, but the Relative Strength Index (RSI) may show the bullish momentum abating if it struggles to hold above 70.
EUR/USD Chart – Daily
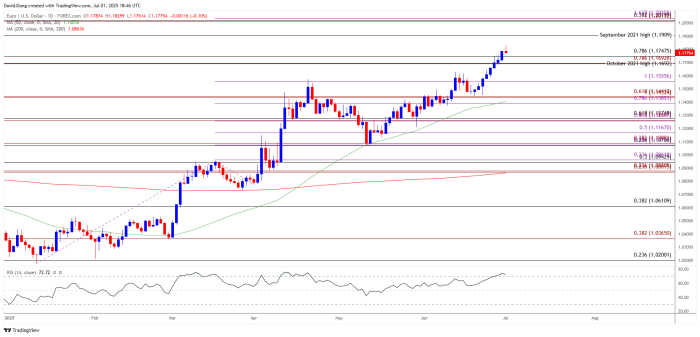
Chart Prepared by David Song, Senior Strategist; EUR/USD on TradingView
- EUR/USD continues to carve a series of higher highs and lows after clearing the October 2021 high (1.1692), with a breach above the September 2021 high (1.1909) opening up the 1.2010 (100% Fibonacci extension) to 1.2040 (161.8% Fibonacci extension) zone.
- Next area of interest comes in around 1.2230 (78.6% Fibonacci extension), but lack of momentum to hold above the 1.1690 (78.6% Fibonacci extension) to 1.1750 (78.6% Fibonacci retracement) zone may push EUR/USD back towards 1.1560 (100% Fibonacci extension).
- Failure to hold above the 1.1390 (78/6% Fibonacci extension) to 1.1440 (61.8% Fibonacci extension) region may lead to a test of the June low (1.1347), with the next area of interest coming in around 1.1260 (61.8% Fibonacci extension) to 1.1280 (61.8% Fibonacci retracement).
Additional Market Outlooks
Australian Dollar Forecast: AUD/USD Eyes November High
British Pound Forecast: GBP/USD Coils Ahead of July
Canadian Dollar Forecast: USD/CAD Tumbles Toward June Low
USD/CHF Selloff Stalls to Keep RSI Out of Oversold Zone
--- Written by David Song, Senior Strategist
Follow on Twitter at @DavidJSong
Related tags:
Latest market news




Open an account in minutes
Experience award-winning platforms with fast and secure execution, and enjoy tight spreads from 0.5 pts on FX and 0.3 pts on indices.
Economic calendar
Web Trader platform
Our sophisticated web-based platform is packed with features.
Related articles
EUR/USD Q4 2026 Outlook: Euro at a Crossroads as Fed, ECB Tighten 9 25 2026
EUR/USD enters Q4 at a pivotal inflection point as competing Fed-ECB policy paths and persistent inflation risks collide with major technical support.


Euro Short-term Outlook: EUR/USD Selloff Nears Critical Yearly Support 9 23 2026
Euro has fallen seven of the past nine sessions, with stretched momentum raising the stakes as EUR/USD closes in on a major inflection zone.

EUR/USD, Nasdaq Price Outlook: Reversal Risks Build
EUR/USD and Nasdaq Price Outlook: Overbought/oversold momentum on hourly and daily time frames is raising reversal risks across the U.S. dollar, EUR/USD and Nasdaq after a strong weekly advance.

This report is intended for general circulation only. It should not be construed as a recommendation, or an offer (or solicitation of an offer) to buy or sell any financial products. The information provided does not take into account your specific investment objectives, financial situation or particular needs. Before you act on any recommendation that may be contained in this report, independent advice ought to be sought from a financial adviser regarding the suitability of the investment product, taking into account your specific investment objectives, financial situation or particular needs.
StoneX Financial Pte. Ltd., may distribute reports produced by its respective foreign entities or affiliates within the StoneX group of companies or third parties pursuant to an arrangement under Regulation 32C of the Financial Advisers Regulations. Where the report is distributed to a person in Singapore who is not an accredited investor, expert investor or an institutional investor (as defined in the Securities Futures Act), StoneX Financial Pte. Ltd. accepts legal responsibility to such persons for the contents of the report only to the extent required by law. Singapore recipients should contact StoneX Financial Pte. Ltd. at 6826 9988 for matters arising from, or in connection with the report.
In the case of all other recipients of this report, to the extent permitted by applicable laws and regulations neither StoneX Financial Pte. Ltd. nor its associated companies will be responsible or liable for any loss or damage incurred arising out of, or in connection with, any use of the information contained in this report and all such liability is hereby expressly disclaimed. No representation or warranty is made, express or implied, that the content of this report is complete or accurate.
StoneX Financial Pte. Ltd. is not under any obligation to update this report.
Trading CFDs carries a high level of risk that may not be suitable for some investors. Consider your investment objectives, level of experience, financial resources, risk appetite and other relevant circumstances carefully. The possibility exists that you could lose some or all of your investments, including your initial deposits. If in doubt, please seek independent expert advice. Visit www.forex.com/en-sg/terms-and-policies for the complete Risk Disclosure Statement.