



Euro Price Outlook: EUR/USD Breaks Out but Will Bulls Drive the Trend?
EUR/USD is trading near a fresh monthly high, but bulls have continually failed to take control of the trend since the pair started to stall at the 1.0500 handle a month ago.
Share this:

Euro, EUR/USD Talking Points:
- EUR/USD broke out to a fresh monthly high on Friday as USD sold off following the Non-farm Payrolls report.
- This bullish breakout comes after some significant stall showed at the 1.0500 handle for the past month. The big question now is whether bulls can finally take over to drive a topside trend, or whether sellers will respond in the same way that they have to resistance over the past month.
- I’ll be discussing these themes in-depth in the weekly webinar on Tuesday at 1PM ET. It’s free for all to register: Click here to register.
The past two weeks have been big: We had rate decisions from both the European Central Bank and the Federal Reserve, and the net takeaway thus far has been a countertrend move in EUR/USD.
The big question now around this theme is whether bulls can take control to turn this into anything more than a pullback; or whether sellers will jump back into the market to take advantage of these fresh higher highs. While the Friday move certainly sticks out on the chart, it’s also contrasting the price action that had shown leading into last week.
Bears took over in July and controlled the pair through the October open, and that’s around the time that the 1.0500 level came into play. I had warned of this in late-September and throughout the month, support continued to build around and eventually just above that 1.0500 big figure. This was emblematic of an oversold move that had priced-in very quickly, and through much of October, when price would work into a pullback, sellers stood at the ready to knock price back down towards support. This even started before the October open, when bears held resistance at 1.0611, which eventually led to a test below 1.0500. That stalled, and then price ran up to the next higher-high resistance level at 1.0636.
Sellers again stood at the ready and swatted price back down, but this time, sellers were unable to get below the 1.0500 level as that helped to hold the daily low. This began the series of higher-highs and higher-lows that largely remains in-place today.
On the daily chart below, I’ve color coded each of these successive swings to illustrate that slow, churning sequence of higher-highs and higher-lows in the pair through the month of October.
EUR/USD Daily Price Chart
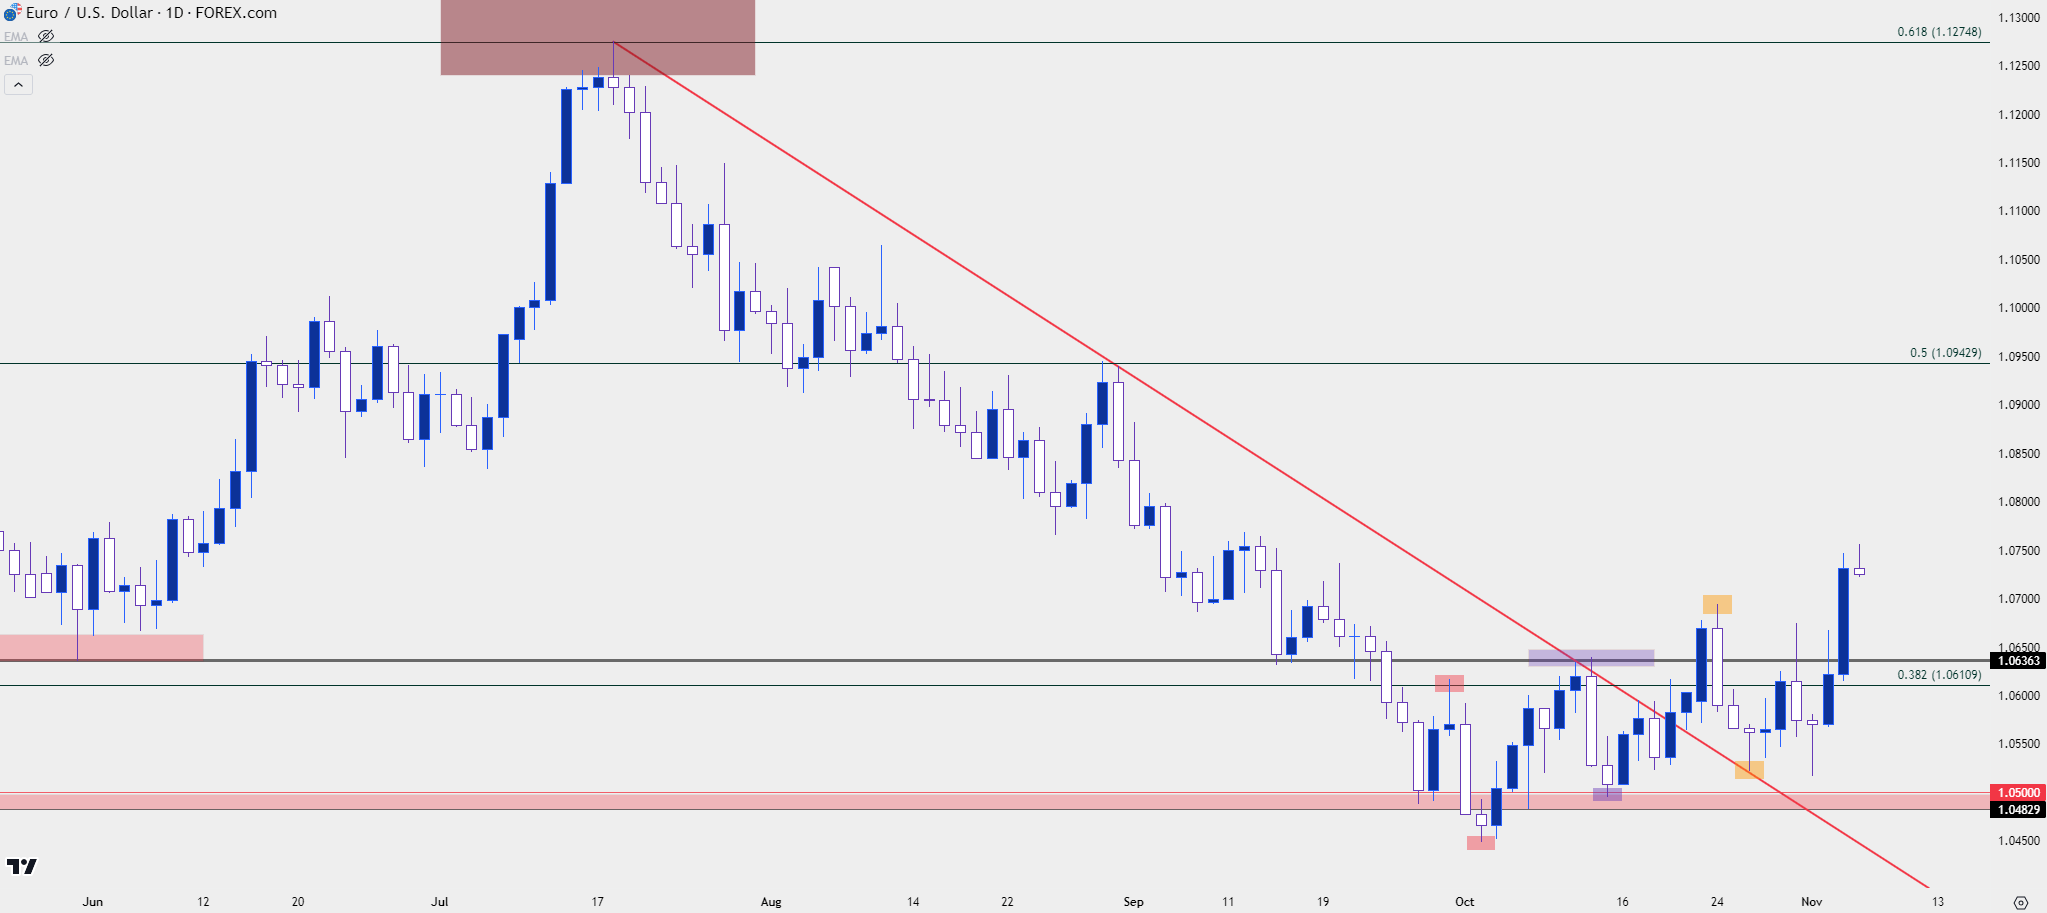
Chart prepared by James Stanley, EUR/USD on Tradingview
EUR/USD Bear Flag
Putting some context around the pullback move, and there has been a bit of consistency. It hasn’t been perfectly clean, particularly around support, but the higher-highs and lows that’ve built over the past month have resided within a bullish channel, and when meshed with the prior sell-off, makes for a bear flag formation.
This formation looked like bears could run with the break last week, just before FOMC. You can see the daily bar spending most of that day below that channel, only for a late-session pullback to pull price right back into that formation. And then with a continued USD sell-off and EUR/USD ramp on Thursday and Friday, price was able to reach to the top of that channel again.
Of note from the below chart is the 1.0943 level. This is the 50% marker from the same Fibonacci study that produced a 61.8% mark at 1.1275, which currently marks the high for EUR/USD, and 1.0611 which has seen considerable action over the past six weeks.
If the pullback can extend and if bulls can turn this into something more, that becomes a level of interest for longer-term plays. And for now, that 1.0611 price becomes a spot of interest for bulls looking to work with higher lows in the pair.
EUR/USD Daily Chart w/ Bear Flag Applied
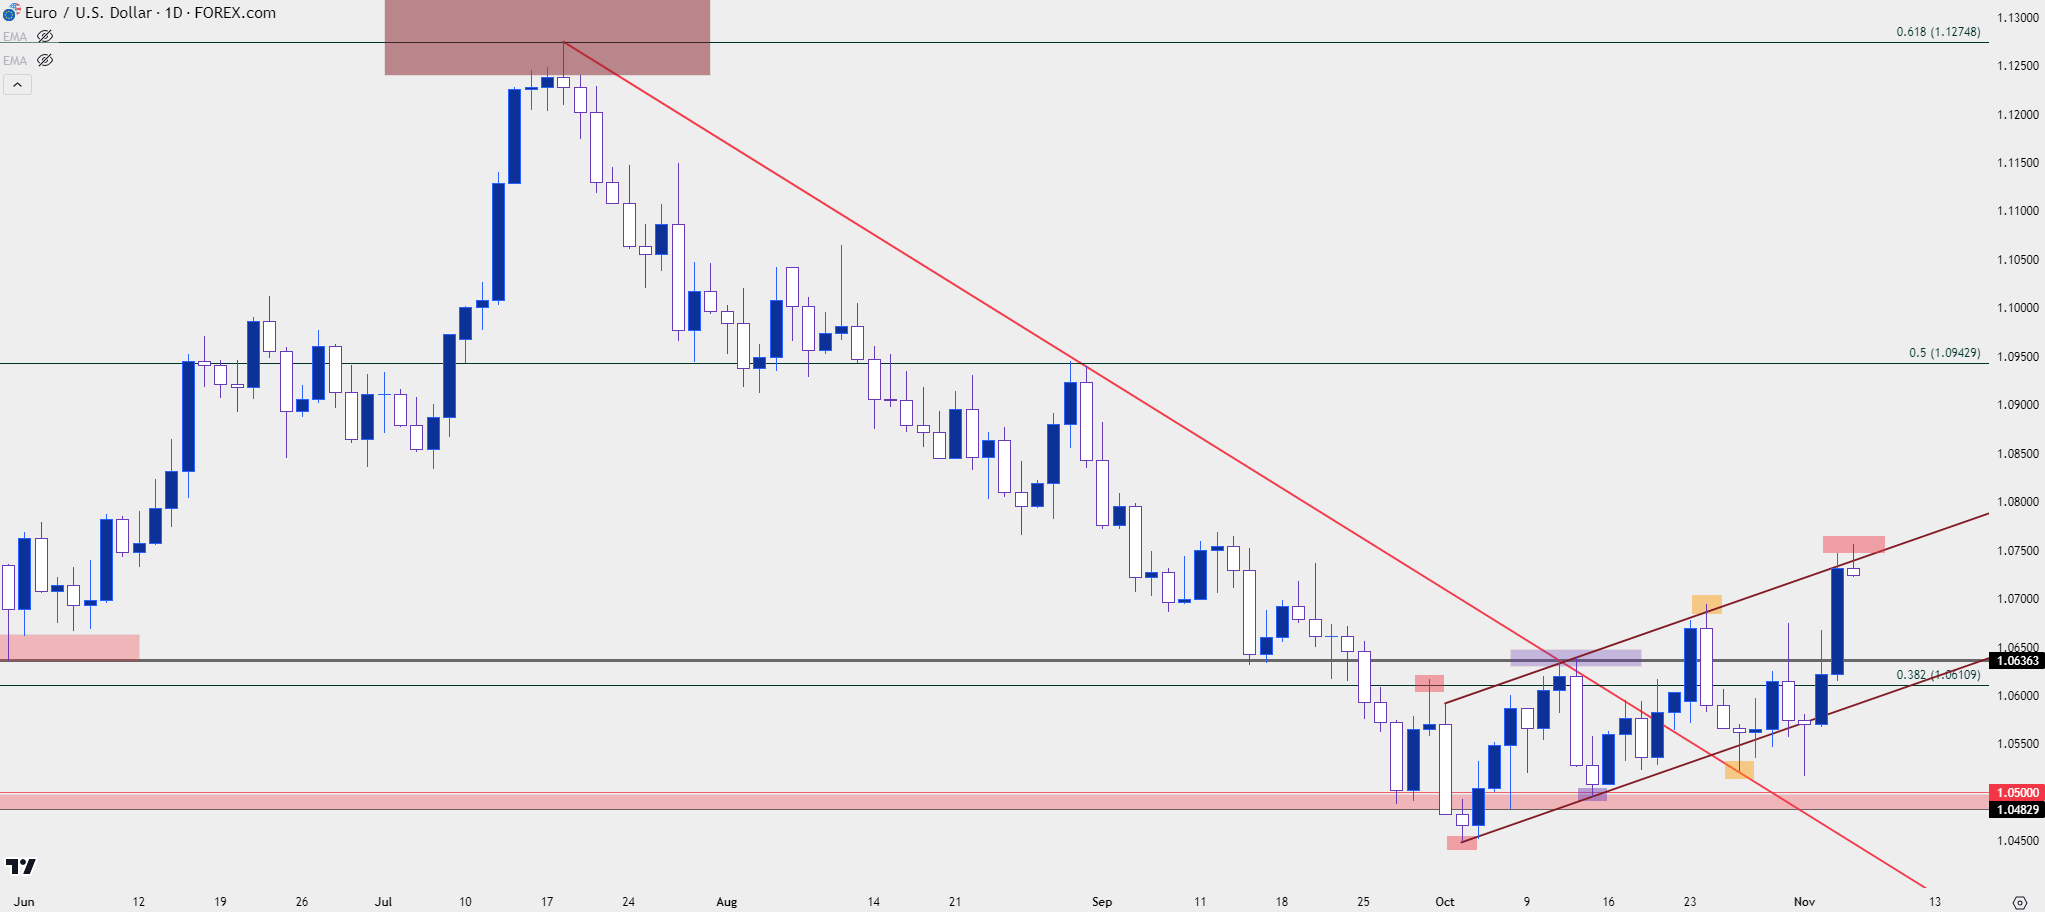
Chart prepared by James Stanley, EUR/USD on Tradingview
EUR/USD: Putting the Pullback into Scope
At this point bears still have something to work with given the hold of resistance within that bullish channel. This keeps the bear flag alive and for EUR/USD sellers, that’s probably one of the more enticing items at the moment.
If bulls can turn this into a larger topside move, there’s a bit of reference that can be taken from the recent sell-off. The 1.0943 level mentioned above is confluent with the 61.8% retracement of the bearish move that began in July. That becomes a notable zone for continued bullish plays, in which swing setups could be investigated.
But there’s some work for Euro bulls to do if they’re going to bring that into the picture, as just overhead sits a confluent resistance level at 1.0766, which is the 38.2% retracement of the recent sell-off, while also being a point of prior support-turned-resistance.
Above that, the 50% marker of the recent sell-off resides at 1.0862; and this becomes a major focal point for bullish trends if buyers can continue to push.
On the underside of price action, there’s a large support zone that runs between two Fibonacci levels. The 1.0611 level can be extended up to 1.0644, which is the 23.6% retracement of the sell-off, to create a support zone. This would seem to be the area that bulls would want to hold if EUR/USD is going to turn this into something more, and if bulls slip, a breach of that area could be seen as a failure to continue the breakout, and that can usher in deeper support levels at 1.0568 or 1.0520 before a re-test of the big figure at the 1.0500 handle.
EUR/USD Daily Price Chart
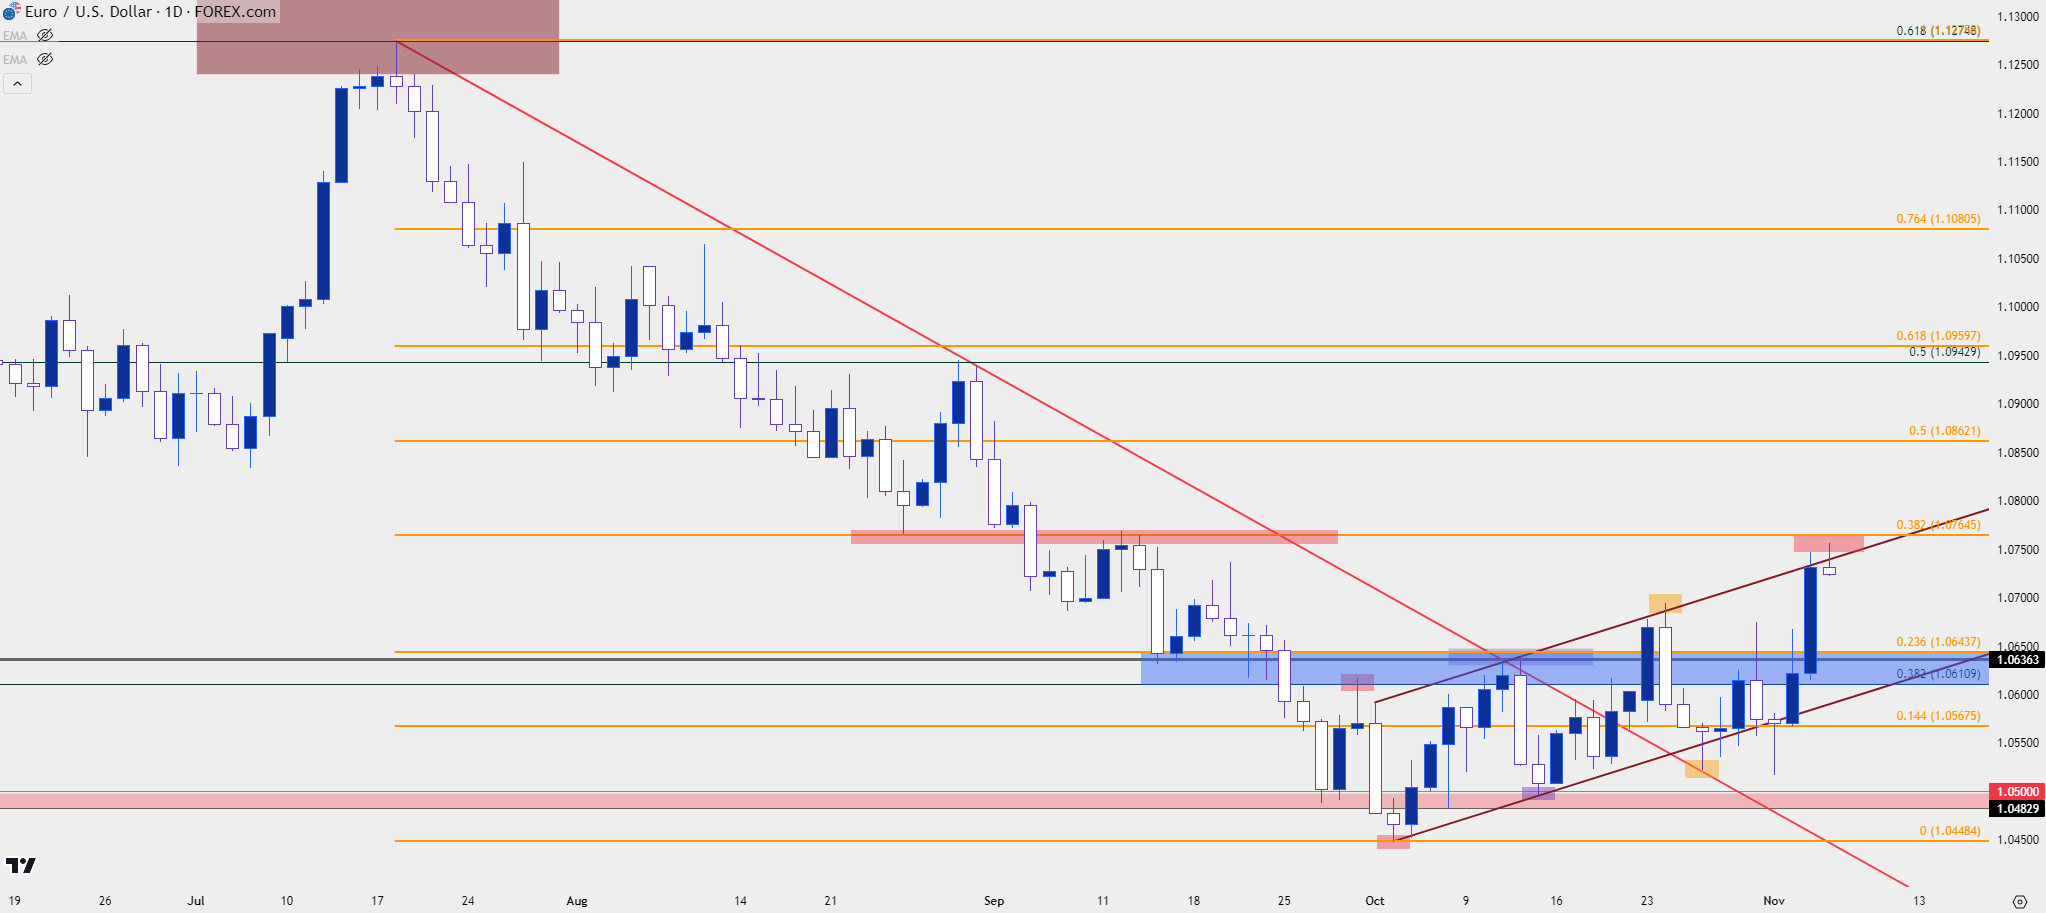
Chart prepared by James Stanley, EUR/USD on Tradingview
--- written by James Stanley, Senior Strategist
Related tags:

Open an account in minutes
Experience award-winning platforms with fast and secure execution, and enjoy tight spreads from 0.5 pts on FX and 0.3 pts on indices.
Economic calendar
Web Trader platform
Our sophisticated web-based platform is packed with features.
Related articles

USD/JPY falters, EUR/USD awaits French bond verdict
The yen has reacted to falling US yields, but the euro faces a different problem. Could French government bond yields provide the additional push needed to break EUR/USD's downtrend?

Gold Bears Approach Major Support, USD/CHF Eyes Reversal
Gold bears approach major support around $4,000, while USD/CHF shows signs of a bearish reversal. Middle East tensions add to market uncertainty.


EUR/USD Forecast: Euro Remains Under Pressure Amid Concerns Over French Debt
Recent trading sessions continue to present a challenging environment for the euro in the short term. This can be seen in the performance of EUR/USD, which has declined by approximately 0.5%, reflecting another loss of ground for the European currency and highlighting the continued strength of the U.S. dollar.

This report is intended for general circulation only. It should not be construed as a recommendation, or an offer (or solicitation of an offer) to buy or sell any financial products. The information provided does not take into account your specific investment objectives, financial situation or particular needs. Before you act on any recommendation that may be contained in this report, independent advice ought to be sought from a financial adviser regarding the suitability of the investment product, taking into account your specific investment objectives, financial situation or particular needs.
StoneX Financial Pte. Ltd., may distribute reports produced by its respective foreign entities or affiliates within the StoneX group of companies or third parties pursuant to an arrangement under Regulation 32C of the Financial Advisers Regulations. Where the report is distributed to a person in Singapore who is not an accredited investor, expert investor or an institutional investor (as defined in the Securities Futures Act), StoneX Financial Pte. Ltd. accepts legal responsibility to such persons for the contents of the report only to the extent required by law. Singapore recipients should contact StoneX Financial Pte. Ltd. at 6826 9988 for matters arising from, or in connection with the report.
In the case of all other recipients of this report, to the extent permitted by applicable laws and regulations neither StoneX Financial Pte. Ltd. nor its associated companies will be responsible or liable for any loss or damage incurred arising out of, or in connection with, any use of the information contained in this report and all such liability is hereby expressly disclaimed. No representation or warranty is made, express or implied, that the content of this report is complete or accurate.
StoneX Financial Pte. Ltd. is not under any obligation to update this report.
Trading CFDs carries a high level of risk that may not be suitable for some investors. Consider your investment objectives, level of experience, financial resources, risk appetite and other relevant circumstances carefully. The possibility exists that you could lose some or all of your investments, including your initial deposits. If in doubt, please seek independent expert advice. Visit www.forex.com/en-sg/terms-and-policies for the complete Risk Disclosure Statement.